Doji Candlestick Pattern: When Traders Doubt
Prepared by the Libertex team
Content reviewed internally in accordance with regulatory standards.
Every trader should be equipped with a wide range of technical tools to define the market direction. These also include candlestick patterns, though not all of them can show the exact market movement. A Doji pattern shows market uncertainties, not price direction. Some may ask, "Why identify a candlestick that doesn't predict price movement?" This article will reveal the purpose of the Doji candlestick, its types and how to use it in trading.
What Is the Doji Pattern, and How Does It Work?
The Doji candlestick is a pattern that signals traders' indecision. It shows the market's doubts about the next price point, so bulls and bears have equal chances of prevailing in the market.
It's one of the easiest patterns. The candlestick should have a tiny body because open and close prices are equal or almost equal. If they are equal, it means that neither bulls nor bears can take control of the market.
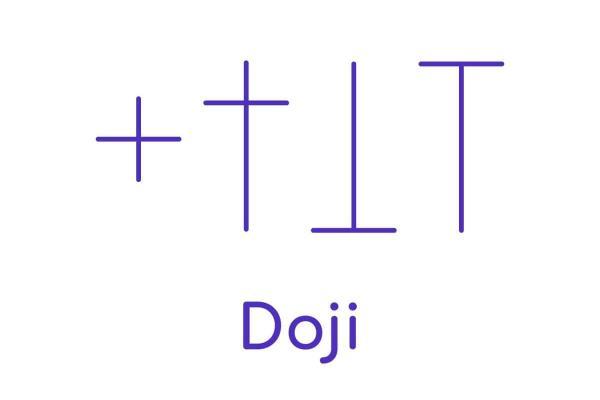
A Doji chart pattern is a candlestick pattern that has the following criteria. First, open and close prices are or almost are at the same level, so the body is tiny. Secondly, there're upper or lower shadows or both.
At the same time, the wicks can have different lengths. Their size reflects the strength of market volatility. The pattern resembles a cross or a plus sign.
There's a common notion that the Doji pattern predicts market reversals, showing the weakness of either buyers or sellers depending on the trend. However, it's not always the case. The candlestick can exist even if bulls/bears continue the trend.
Doji Candlestick Pattern Example on the Forex Market
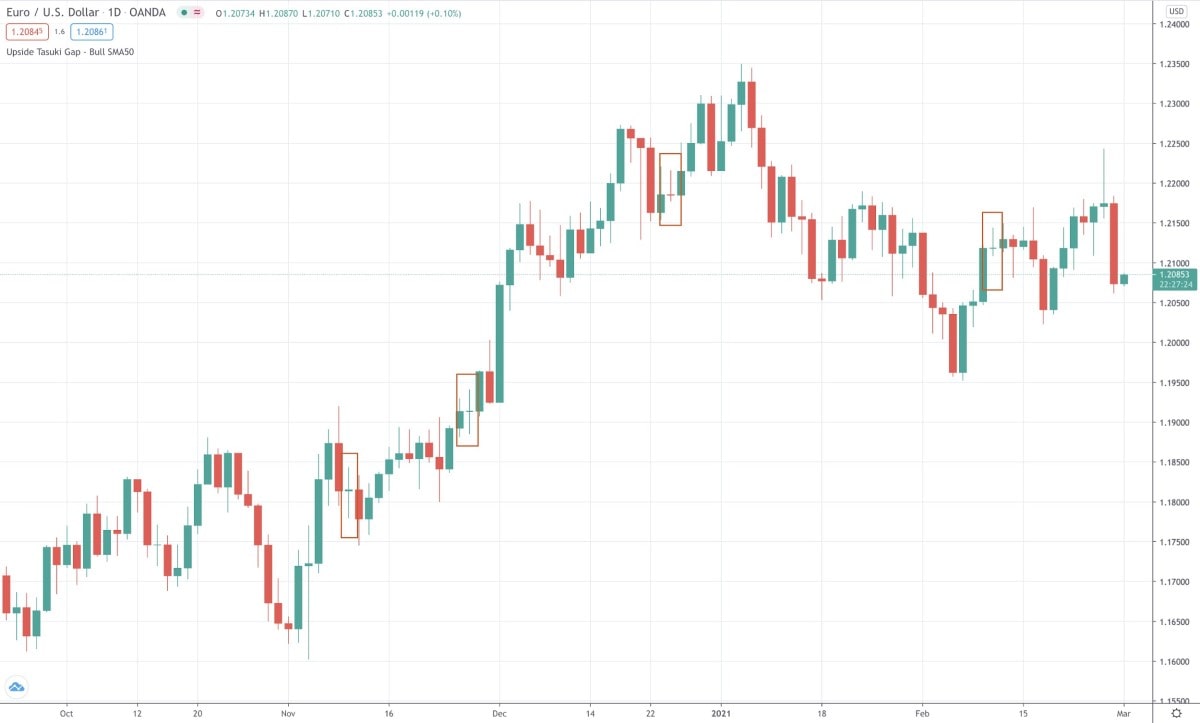
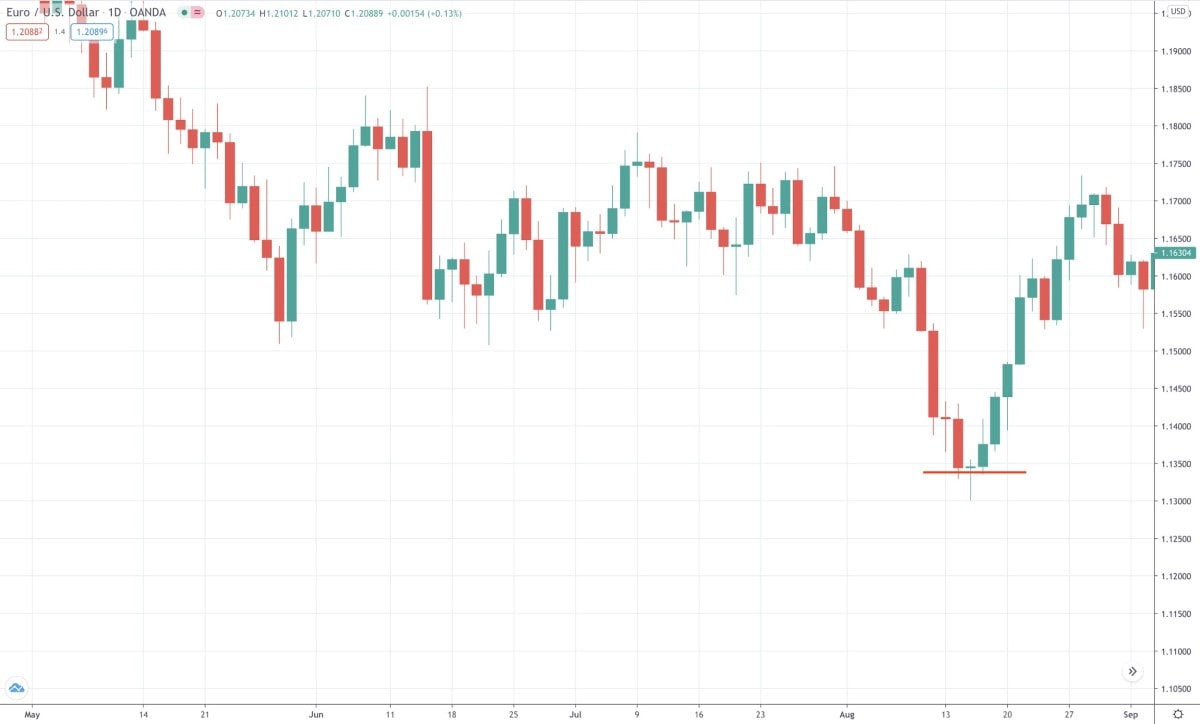
Although the pattern is simple, it's worth looking at how the candlestick performs in real trading.
If you look at the daily chart of the EUR/USD pair, you'll see many Doji candlesticks formed in different market trends.
Doji and Spinning Top: Are They Different?
There's another indecisive pattern, a Spinning Top candlestick. Although both look similar, the Spinning Top candle has a bigger body and long shadows. In comparison, the Doji candlestick can have different-sized shadows.
Doji and Spinning Top candlesticks look similar. Still, the Spinning Top has a bigger body. Both Spinning Top's shadows are long, while the Doji candlestick can have different-sized shadows.
There's a rule: if it's a Doji candlestick, the body will be up to 5% of the entire candlestick's size. If the body seems bigger than 5%, it's a Spinning Top.
Of course, measuring in percentages is hard. That's why you should practice spotting them. Only when you find at least ten Doji candlesticks on the price chart will there be enough confidence that you'll be able to identify them later. A Libertex demo account is a perfect way to practice without the risk of losing money.
Doji Candlestick Types
The Doji candlestick has five types that differ by the shape of the candlestick. Let's look at them.
There are five main types of the Doji candlestick: common Doji, Long-Legged Doji, Dragonfly Doji, Gravestone Doji and Four-Price Doji.
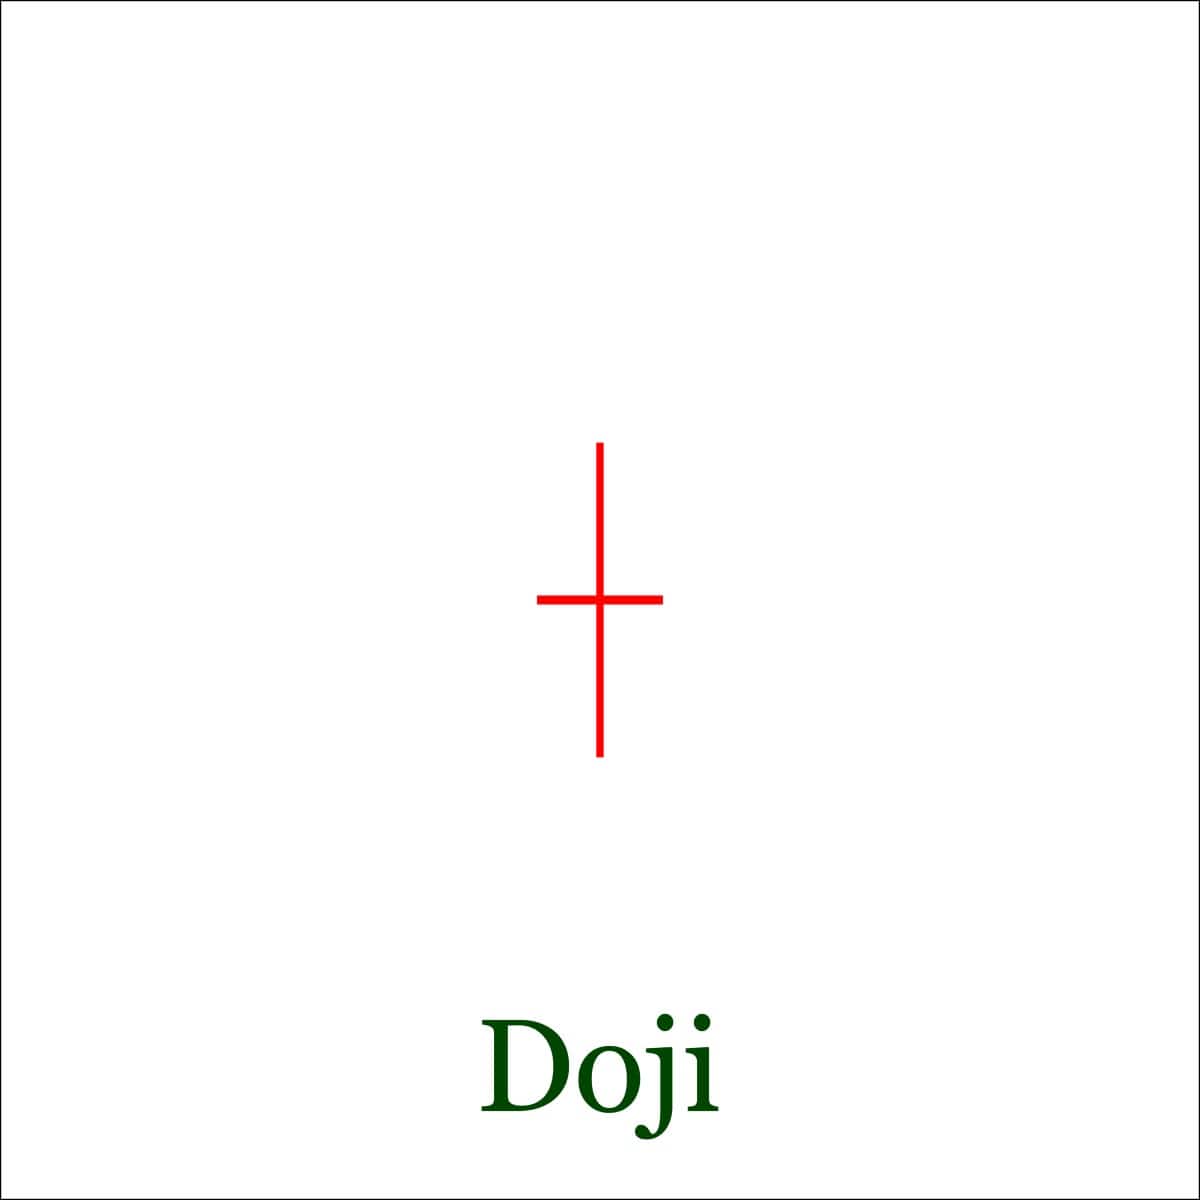
Common Doji
It's the most frequent form of the Doji candlestick. This candlestick has a small body and shadows. It forms when the traders are unsure about the foreseen market direction, and it looks like a plus sign.
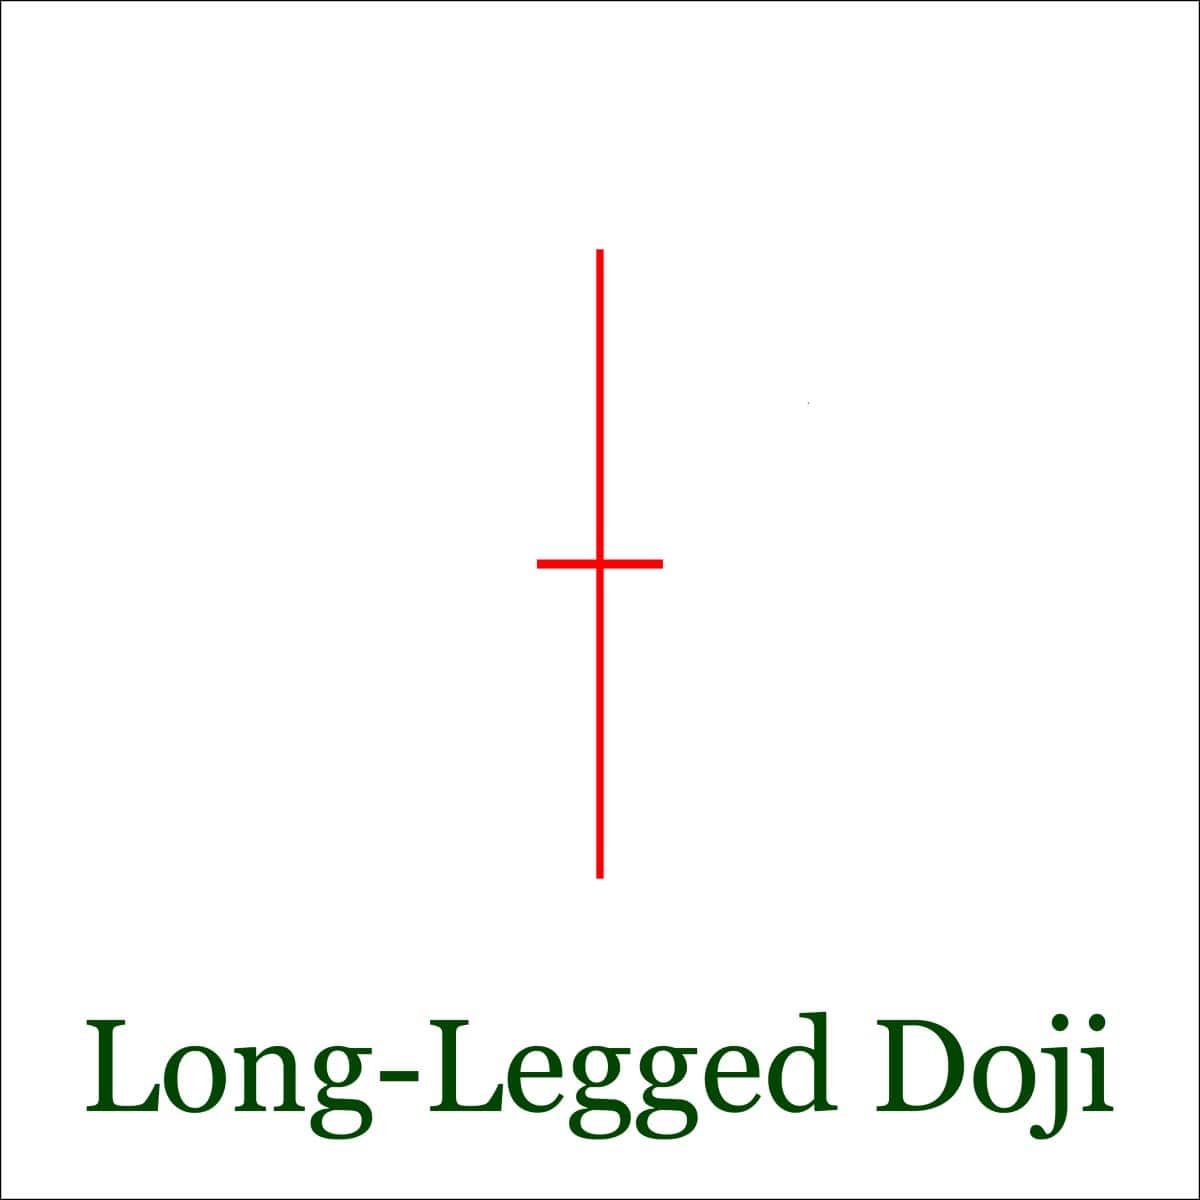
Long-Legged Doji
Similar to the common type, this candlestick has longer shadows, and the body is still small as the price opened and closed at almost the same level. This candlestick can hardly be used as a signal of the future market direction. It signals indecisive traders.
The Long-Legged Doji can signal both a market correction and a reversal.
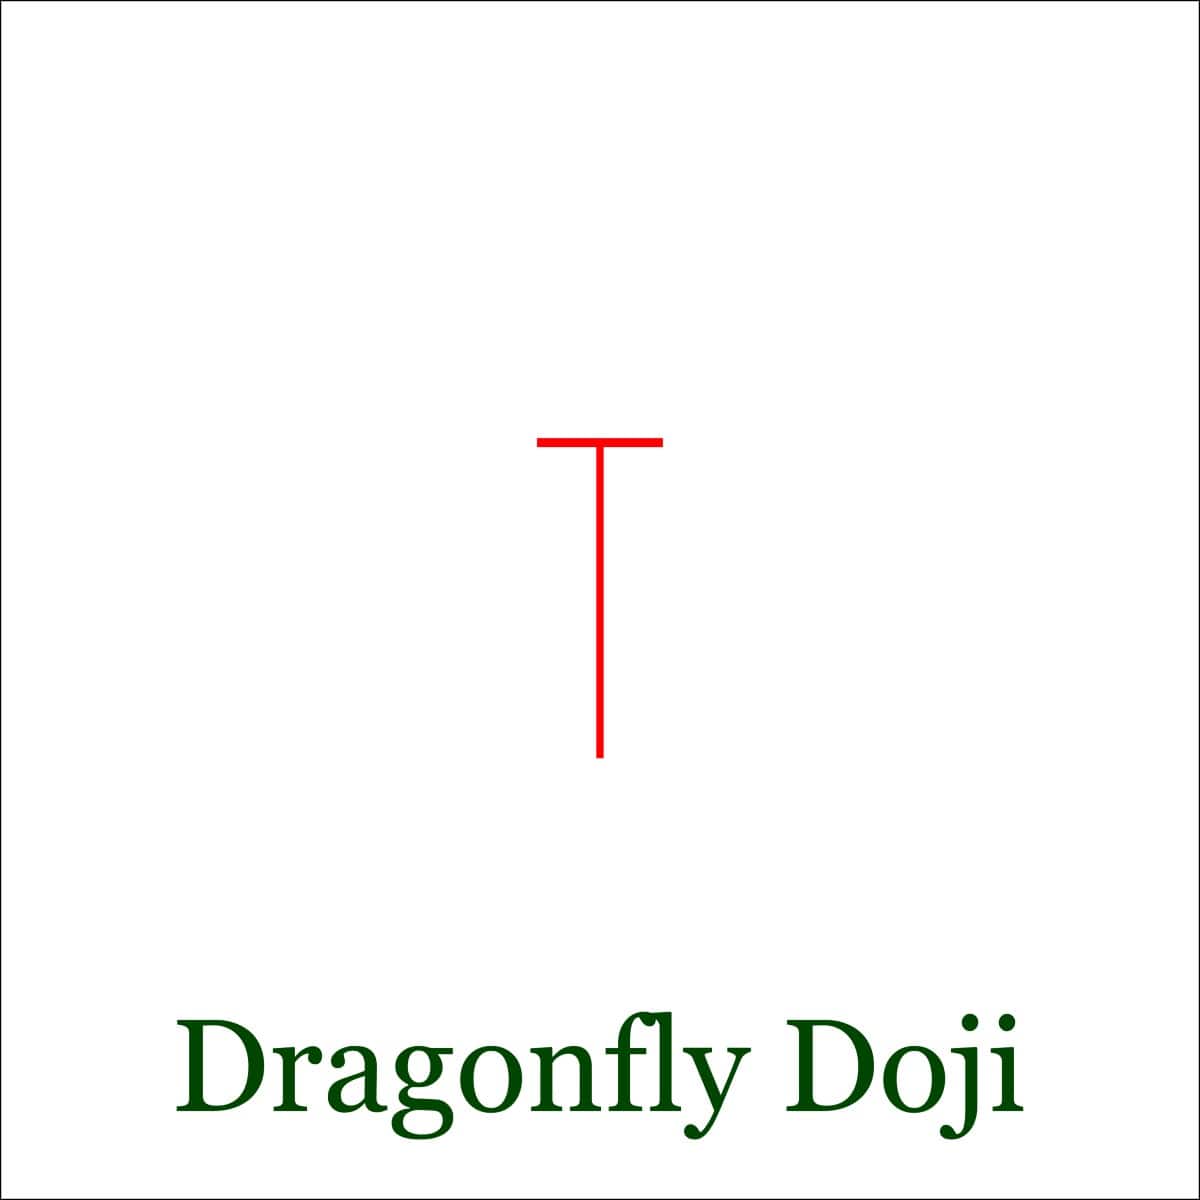
Dragonfly Doji
Dragonfly Doji is a type formed in a specific way. The open and close prices are close to each other and the high price. Thus, the upper part of the candlestick is small and barely has the upper shadow. At the same time, it has a long low shadow.
This type can occur in an uptrend and downtrend, and it's more reliable at the end of the downward trend.
The candlestick resembles a hanging man and a hammer pattern. But the latter have big bodies, while the Doji candlestick has a tiny one.
As the Dragonfly Doji has a long low shadow, it means bears were strong during the candlestick's formation. The price didn't close low, moving up to the open price, meaning bears have lost their force.
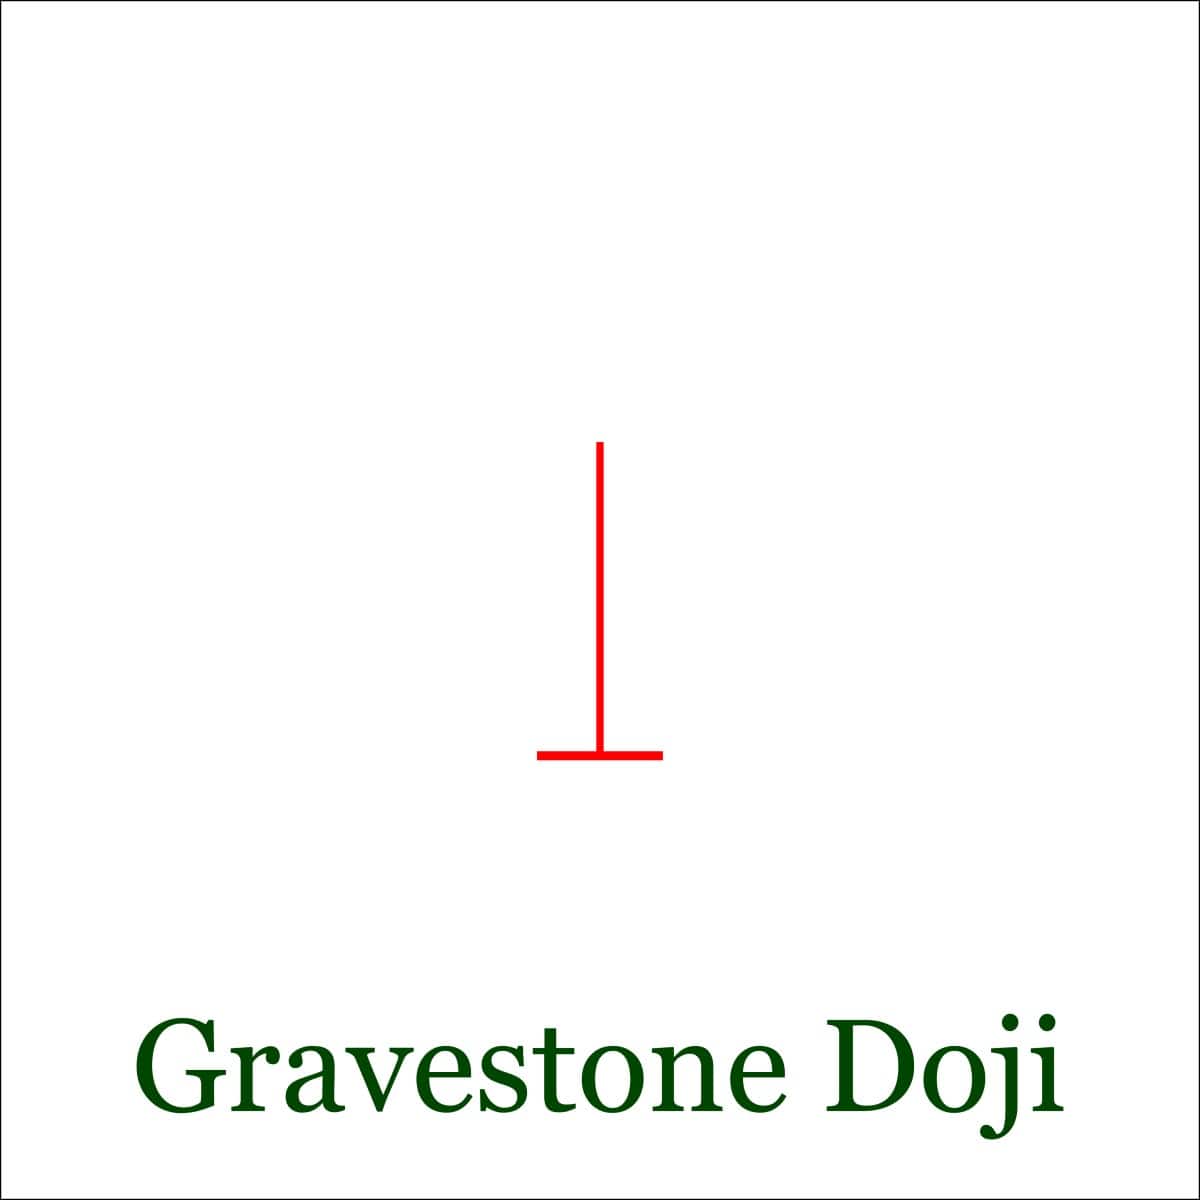
Gravestone Doji
It's the opposite type of the Dragonfly Doji and is considered a bearish reversal pattern. It has a long upper shadow, a small body and a lack of or a small low shadow.
It shows that the bulls were strong but couldn't stick to highs, and the price declined. Bears have gained momentum, and as a result, there's a high chance of a strong downtrend. The signal is even more reliable when formed on the top of the uptrend; it can be stronger than a shooting star.
Here's a small strategy: if there's a gravestone Doji candlestick on a price chart, you can open a short trade. However, the short position will be successful if there's a breakout below the Doji's low. If the price stays higher than the Doji's low, there's a chance the upside movement will resume.
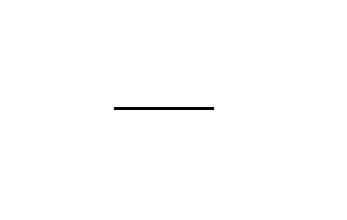
Four-Price Doji
The Four-Price Doji is the rarest type. The candlestick has four equal prices: low, high, close and open. It looks like a minus sign or a horizontal line and signals a lack of volatility and certainty regarding the future price direction.
If you see such a pattern, you can be sure the market is in doubt. You better avoid any trades during such moments.
Doji Star Pattern
Although it's not technically a type of Doji pattern, we'd like to mention it.
A Doji Star is a three-bar pattern and can be bullish and bearish, signalling a possible market reversal.
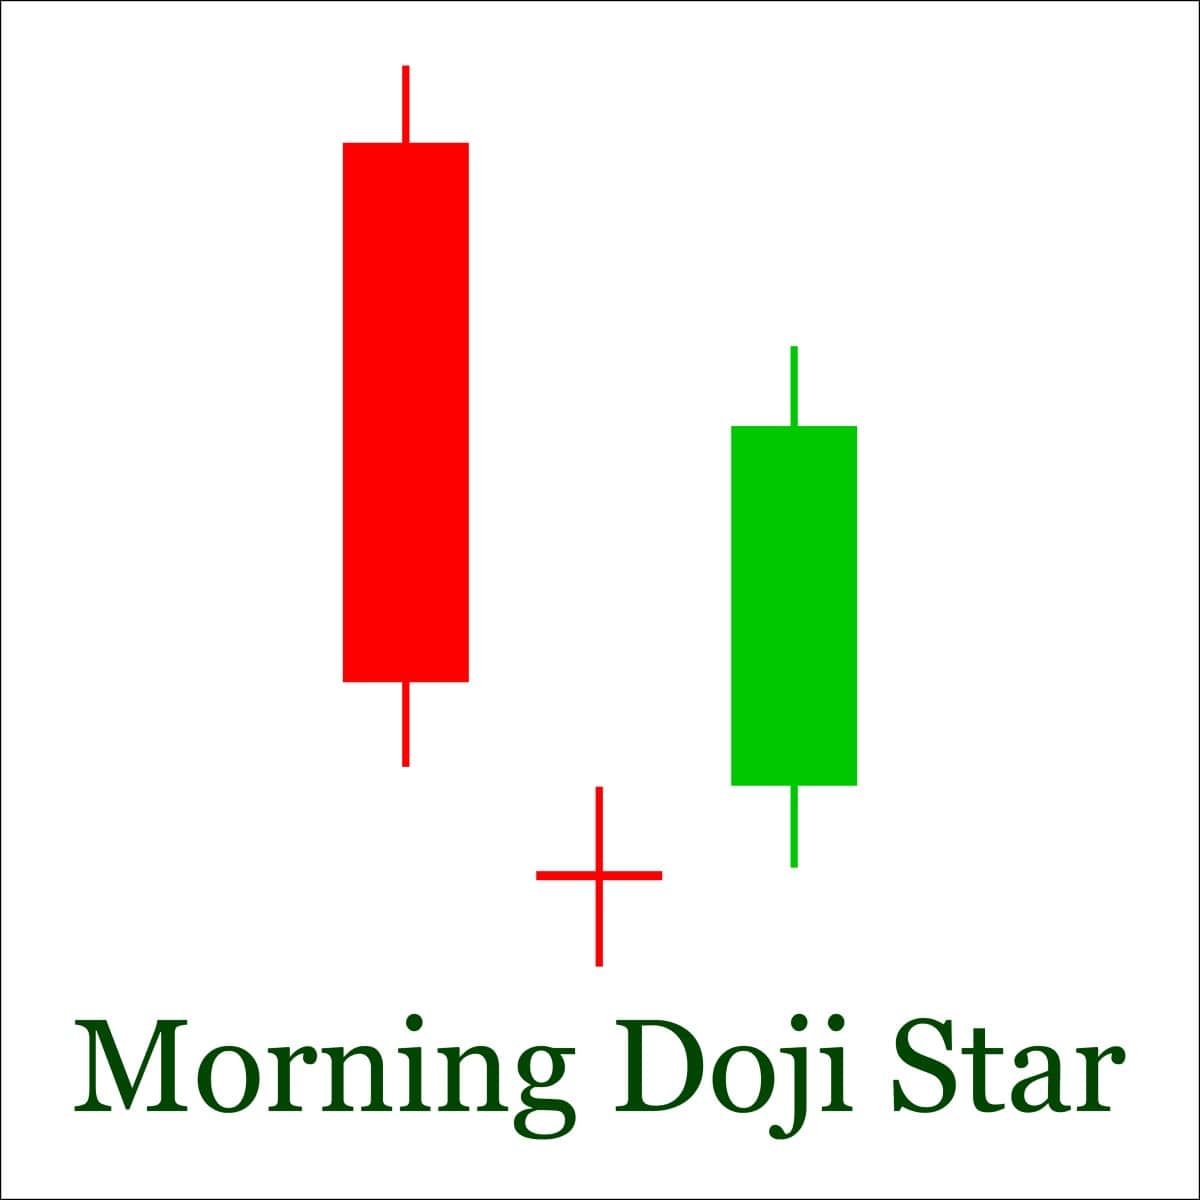
We expect a reversal upward if it's a bullish (or Morning) Doji Star pattern. It consists of three candles:
- The first candlestick should be big and bearish.
- The second one should be a Doji candle closing below the previous one's body.
- The third candlestick should open above the Doji Star pattern and be bullish. Then we can expect a price reversal.
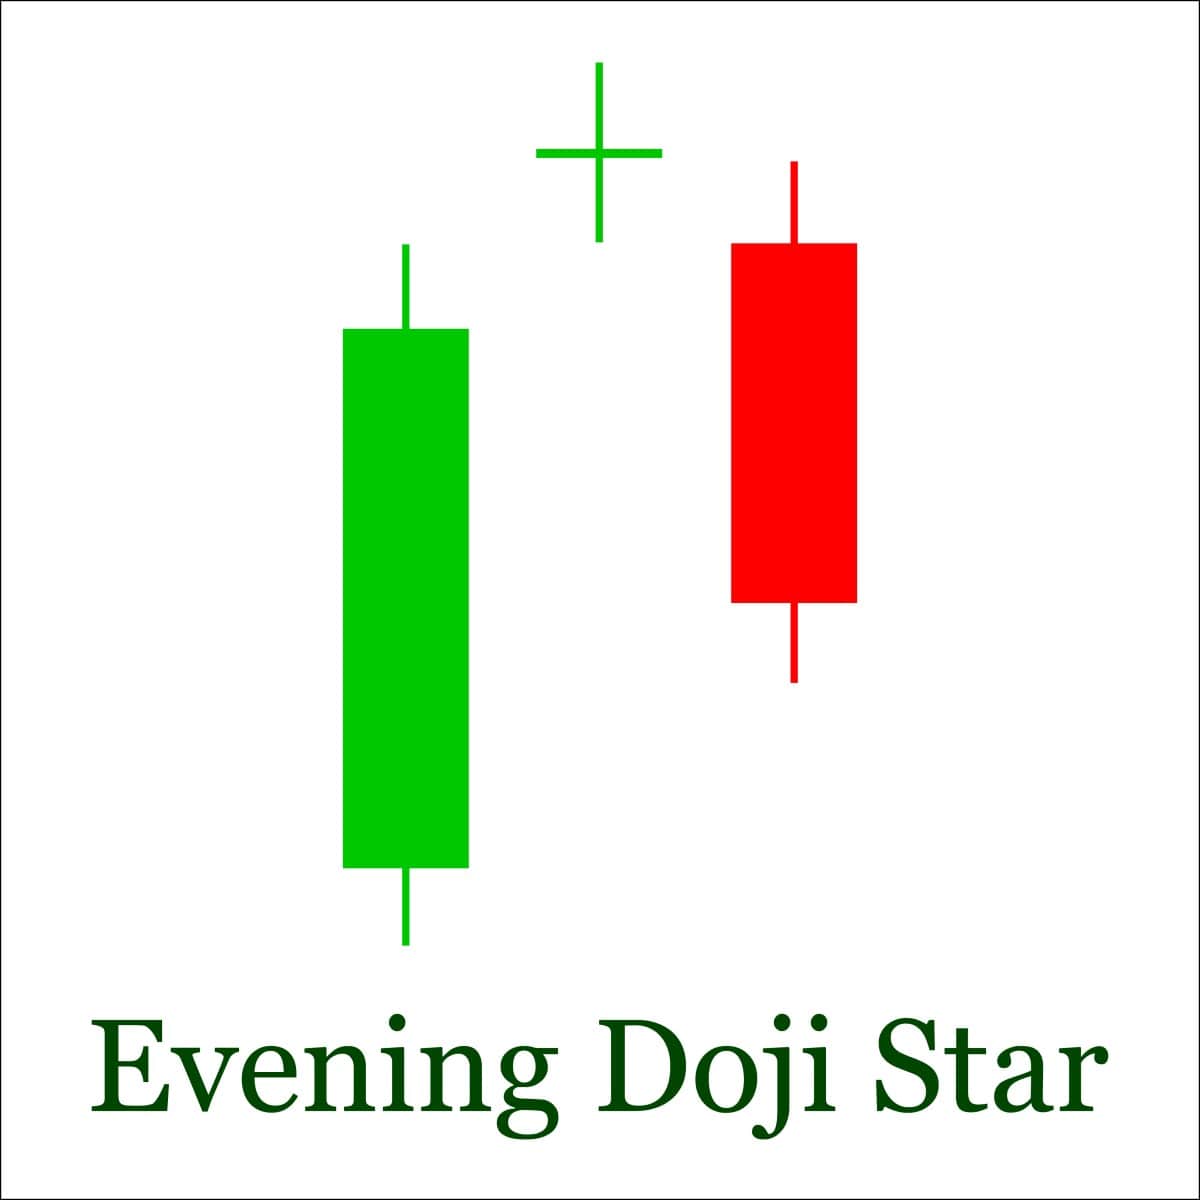
A bearish (or Evening) Doji Star pattern means we expect a downward movement:
- The first candlestick should be big and bullish.
- The second candle is a Doji Star that opens above the open price of the first candlestick.
- The third candlestick should be bearish and stay below the Doji one.
Traders use the Doji Star patterns to either avoid entering the market within the current trend or open a trade on a market reversal.
Advantages and Disadvantages of the Doji Candlestick
|
Benefits |
Limitations |
|
|
The candlestick can be found on any timeframe for any asset. It's one of the simplest patterns. No special knowledge is required to define it. Although the candlestick doesn't provide accurate trend reversal or continuation signals, it may be an alarm when the market is ready to turn around. Traders can use such signals to enter or exit a trade.
Please be reminded that the signal is only reliable if there's confirmation from other technical tools.
Although the Doji candlestick doesn't provide accurate trend reversal or continuation signals, it may indicate when the market is ready to turn around.
As for the limitations, the Doji candlestick reflects the uncertainty of traders and the signals. It's not the best pattern to use for defining the price direction. Some traders struggle to tell the difference between the Doji candlestick and Spinning Top.
How to Read a Doji Chart Pattern
The Doji candlestick signals uncertainty among traders. It means there's almost a 50/50 chance the market will move either up or down. Still, if you read the signals correctly, you can get more information from this pattern.
The type and location of the Doji candlestick will determine your trading strategy.
Step 1. Define the Candlestick Type
The type will determine your trading strategy. For instance, if the candlestick has long legs, it means the market strongly fluctuates, and it's dangerous to enter it. If it's a Gravestone Doji, you should expect a downward movement. If you see a Dragonfly Doji, an upward movement may occur. If it's a common Doji, there's a high risk the market is unsure; you should stay away from making new trades.
Step 2. Check Where the Candlestick Is Located
If it's at the end of the long downtrend, there's a chance of an uptrend. If it's at the top of the bullish trend, the market may move down.
Step 3. Don't Enter the Market Without Confirmation
For this step, use technical indicators and chart patterns. If you expect a market reversal, use such indicators as MACD, RSI, Awesome Oscillator, Stochastic and Moving Averages. If your bet isn't confirmed, the market may keep moving in the same direction, or a correction will occur.
Never enter the market when you see a Doji candlestick, provided there's no more confirmation of the upcoming market direction.
How to Use the Doji Candlestick in Trading: Best Strategies
The Doji candlestick doesn't provide an accurate signal on the price direction. Use it with other technical tools. Here's a couple of trading strategies.
Strategy #1: Common Strategy
The most widely used strategy applies both to upward and downward movements.
If you expect the market to move up after the Doji candlestick, wait for a confirmation (the following candlestick should open above the Doji candlestick body). Afterwards, open a long trade. The Stop-Loss level can be placed below the Doji candlestick's low.
If you expect a downward movement after the Doji's formation, open a short trade after the following candlestick is formed. The Stop-Loss level is located above the high of the Doji candlestick.
The Take-Profit level is a difficult point in this strategy, so it's better to place support and resistance levels to signal a possible market reversal.
Strategy #2: Doji and Trend Trading
We'd like to remind you that the Dragonfly Doji is a sign of possible upward movement.
- Step 1. Look for a Dragonfly Doji candlestick in the downtrend.
- Step 2. It should be near the support level. In our case, the support level isn't visible, but it's based on previous lows. There should be a pullback as every uptrend has periods of correction.
- Step 3. If the Dragonfly Doji is formed near the support level, it's a sign of the possible market reversal.
- Step 4. Wait for confirmation. A bullish candlestick should form after the Doji candlestick, and then you can open a long position.
Conclusion
The Doji candlestick pattern is neutral. It provides neither continuation nor reversal signals but reflects market uncertainty and doesn't give accurate signals on the price direction. Although Gravestone Doji and Dragonfly Doji are expected to predict a market reversal, their signals need to be confirmed.
To be successful at defining its signals, practice spotting them on the chart. The best way is to open a Libertex demo account where you can trade a wide range of CFD underlying assets, without any risks. After you practice, feel free to open a real account.
It's time to summarise.
FAQ
What Is the Doji Candlestick Pattern?
The Doji candlestick pattern is a candlestick that has a small body and long shadows. It reflects market uncertainties and barely provides signals of a market reversal.
Is Doji a Reversal Pattern?
The Doji candlestick is a neutral pattern. Gravestone Doji and Dragonfly Doji may signal a price reversal, but they need confirmation.
What Does a Doji Indicate?
The Doji indicates market indecision.
What Does Double Doji Mean?
A double Doji is just a situation when the market is highly indecisive. The main idea is to wait until a new candlestick is formed after both Doji candlesticks. Until then, the trader shouldn't enter the market.
What Does a Long-Legged Doji Mean?
A Long-Legged Doji means the market is highly volatile. It's dangerous to open a position unless you're an experienced trader.
What Is a Bearish Doji?
A bearish Doji is a candlestick followed by a downward movement. The Gravestone Doji is considered a bearish Doji type.
What Happens After a Doji?
After the Doji, the market can have any of the three directions: upwards, downwards and sideways.
What Is Morning Doji Star?
A Morning Doji Star pattern is a three-candlestick Doji chart pattern. It's considered bullish, so the market is supposed to move up after it.
How Do You Trade the Doji Candlestick Pattern?
Before you enter the market, get a confirmation of the upcoming price direction. If the Doji candlestick is formed within a strong trend, it can signify the market reversal. Consider closing the current trade.
Is a Doji Bullish or Bearish?
The Doji candlestick is neither bullish nor bearish. The future price direction depends on the strength of bulls and bears.
What Is a Bullish Doji?
The bullish Doji is a candlestick that is followed by an upward movement. The Dragonfly Doji is considered a bullish Doji type.
Disclaimer: The information in this article is not intended to be and does not constitute investment advice or any other form of advice or recommendation of any sort offered or endorsed by Libertex. Past performance does not guarantee future results.
Why trade with Libertex?
- Get access to a free demo account free of charge.
- Enjoy technical support from an operator 5 days a week, from 9 a.m. to 9 p.m. (Central European Standard Time).
- Use a multiplier of up to 1:30 (for retail clients).
- Operate on a platform for any device: Libertex and MetaTrader.