
Parabolic SAR: Points of the Trend
Prepared by the Libertex team
Content reviewed internally in accordance with regulatory standards.
The Parabolic SAR is the technical indicator traders use to predict the trend direction along with entry and exit points. Although it provides easy-to-read signals, it has many pitfalls that should be considered when trading. Let's see when you should use this tool.
What Is a Parabolic SAR Indicator
Parabolic SAR (PSAR) is a technical tool used by traders worldwide that reflects the security's direction. SAR stands for stop and reversal. The indicator is widely used to show the current trend, signal a market reversal, providing entry and exit points.
Parabolic SAR is a technical tool that reflects the asset's direction.
J.Welles Wilder Jr. created this instrument. If you’re familiar with the RSI (Relative Strength Index) indicator, you’ve heard this name for sure. The RSI is one of the easiest, most widely used indicators. So be sure to keep reading about the PSAR indicator.
How to Recognise Parabolic SAR
PSAR consists of dots that move in the price direction. As a trend indicator, it’s located on the price chart, not in the window below. If there’s a bearish trend, the dots are above the candlesticks and move downwards as if they put pressure on the price, forcing it to go low. If the trend is bullish, dots are below the candles and move up. Imagine dots supporting the price, pushing it upwards.
How to Set Up Parabolic SAR in MT4
Parabolic SAR is a standard tool in the MetaTrader platform, meaning you can quickly implement it on your price chart.
Parabolic SAR is a common tool in the MetaTrader platform.
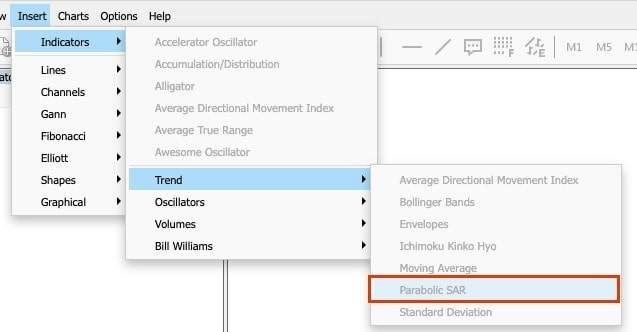
Click Insert in the upper panel of the trading platform, then Indicators -> Trend -> Parabolic SAR.
The indicator has only two settings: Step and maximum. Their default values are 0.02 and 0.2, respectively. A step is the size of the acceleration factor. The acceleration factor starts with this value and increases by the step size with each new high for an uptrend (or low for a downtrend), up to the amount defined by the “maximum” parameter.
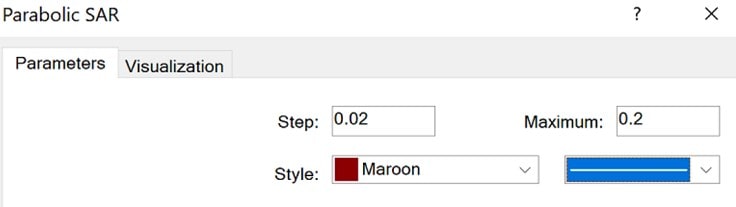
You can try other parameters for the indicator, but the standard ones suit basic trading strategies best.
Parabolic SAR Formula
Although the indicator is set automatically, you should know the Parabolic stop and reverse formula to understand how it works.
The indicator has a perfect default setting that will suit any trading strategy.
To get the uptrend's dots, subtract the prior Parabolic SAR from the prior extremum (higher high in the uptrend and lower low in the downtrend). The result should be multiplied by the previous acceleration factor (the standard is 0.02, which rises each time a new extremum forms by 0.02, maximum is 0.20). The result should then be summed with the prior Parabolic SAR.
| Parabolic SAR = Prior Parabolic SAR + Prior acceleration factor (Prior extremum - Prior Parabolic SAR) |
For the downtrend, the formula looks similar. Extract the prior extremum from the prior PSAR indicator. The result should be multiplied by the preceding acceleration factor. Another difference is that you need to subtract the result from the prior parabolic SAR.
| Parabolic SAR = Prior Parabolic SAR - Prior acceleration factor (Prior Parabolic SAR - Prior EP) |
Reading Parabolic SAR
Reading the signals of the Parabolic SAR indicator is quite simple. It’s presented by dots that move either above or below the candlesticks.
There are three primary indicator signals. These are Trend Direction, Trend Reversal and Trailing Stop-Loss.
Trend Direction. The trend is confirmed as soon as the indicator forms three dots in the primary movement direction. It means you can open a position in the trend direction. A crucial point: the indicator creates dots, regardless of whether the trend is strong. If, for instance, the market moves sideways, forming small swings, the indicator will provide plenty of fake signals.
That's why we recommend:
- Using the indicator for big timeframes. It’ll prevent you from the noise of multiple signals.
- Combining Parabolic SAR. It's essential to combine the indicators to get stronger signals. See an example with Moving Average below.
- Trend Reversal. It's also possible to use Parabolic SAR to define the reversal of the current trend. Wait until the dots change their direction. If a single dot is located opposite to current ones, you should close the trade.
- Trailing Stop-Loss. Sometimes, the indicator is used as a Trailing Stop-Loss. You can follow the movement of the indicator, changing the location of the Stop-Loss. The change in the indicator's direction will signal a position's close.
Combining Parabolic SAR
Let's see what indicators you can combine with the Parabolic SAR to get reliable alerts. The Parabolic SAR is a trend indicator that shows market reversals. You can use it with oscillators that confirm the turn of the price - for example, the RSI and MACD indicators.
The Parabolic SAR tool can be easily combined with both trend indicators and oscillators.
Also, Parabolic SAR is widely used with Moving Averages. Moving Averages are applied to the chart to define the trend direction. Still, unlike the Parabolic SAR, it moves sideways when the market consolidates. Using both indicators, you won't fall into the trap of the Parabolic SAR.
Forex Trading with Parabolic SAR Indicator
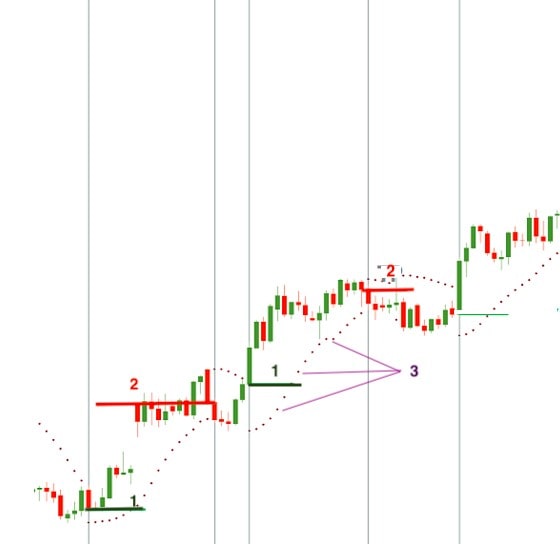
Let's consider a real example of Parabolic SAR trading. In the picture below, we have a strong uptrend of the asset, which means we should open a buy position (1). The Take-Profit isn't determined in advance (2). We close the trade as soon as the indicator signals a downtrend.
Also, on one of the chart parts, you can see an example of the Trailing Stop-Loss (3). It can be moved in the direction of the uptrend.
Parabolic SAR: Benefits and Disadvantages
PSAR isn’t the basic indicator for trading strategies as it has some drawbacks. Check them to know how to use the indicator effectively.
|
Benefits |
Disadvantages |
|
Simple. The tool has only two settings that suit all basic trading strategies. |
Need to be confirmed. The indicator isn’t the most reliable tool you can use to define the trend direction. Combining it with other instruments will provide reliable entry and exit points. |
|
Clear signals. The indicator provides clear signs that don't require specific knowledge to be read. |
Rare in strategies. Although the PSAR indicator is one of the most accessible, it's not as famous as MACD, Moving Averages, RSI, etc. |
|
Major signals. The indicator submits vital signs as the trend direction, reversal points and Trailing Stop-Loss levels. |
Used only in strong trends. The indicator doesn't work well when the market consolidates. It may provide many fake signals. |
|
Smaller lag. Although all indicators have a time lag, the Parabolic SAR tool has the smallest one based on the previous price number. It reflects the price changes almost immediately, forming new dots. |
Parabolic SAR: Your Perfect Strategy
If you still have doubts about applying the indicator to your trading, here’s a strategy that will help you get started. Parabolic SAR works well with the Moving Average indicator, so it can be used for smaller time frames.
For example, we’ll use a 30-minute chart of the EUR/USD pair, the most reliable asset for beginners. Moving averages should have a period of 20 and 40.
Step 1. Apply the Parabolic SAR indicator with standard settings and 20-, 40-period moving averages on the price chart.
Step 2. The cross of moving averages is the primary signal the indicator provides. We’re considering the sell trade; thus, we need to find a dead cross. It’s when a Moving Average with a smaller period crosses the one with a more significant period upside-down.
Step 3. Get confirmation from the Parabolic SAR. Previously, we said that the indicator reflects all ups and downs of the price chart. Even if the primary trend is bearish, the small swing up will be noticed by the indicator.
Step 4. As soon as the Parabolic SAR forms dots above the price chart, signalling the downtrend, we can move to the next step. Open a sell trade at the candle's opening that follows the formation of the first dot above the candlesticks.
Step 5. Now, it's time to limit possible losses if the price changes direction due to high volatility caused by unexpected fundamental factors. The Stop-Loss may be located at 30-50 pips above the entry point. Check previous support and resistance levels. The Stop-Loss should be slightly above the resistance level.
Step 6. Let's take the profit as moving averages are more robust tools than the Parabolic SAR; we should follow their signals. Close your trade as soon as moving averages form a golden cross.
This was an example of the sell trade. Opposite rules apply to the buy trade.
Tips for Traders
Check these tips that will prevent you from making mistakes.
- Fake dots. The most common mistake is to open trades any time the indicator forms dots. It leads to losses as Parabolic SAR doesn't reflect the sideway direction. The market creates small swings and frequently changes direction as you don't have time to collect the potential profit.
- Not enough dots. The standard rule is to open a trade as soon as at least three dots are formed in one direction. Otherwise, there are risks of fake signals.
- Wrong settings. It's recommended to use default settings as they provide the best step size that will neither create additional dots nor make significant lags.
Why Use a Parabolic SAR Indicator
Although the indicator has disadvantages, it’s a default indicator in the MetaTrader platform. Apply it to your trading strategies because it’s:
- Easy to use. The indicator provides simple signals and doesn't require special knowledge to use it.
- Easy to combine. Use it with other tools that provide the same signal for trend reversal.
- Easy to set. Unlike most indicators, Parabolic SAR doesn't require changing the settings. Use the default ones to get signals.
Conclusion
The Parabolic SAR indicator is one of the easy-to-use tools, especially for beginners. But it provides plenty of fake signals if you use it without confirmation and for sideways movements.
To practice using the indicator effectively, we recommend opening a Libertex demo account. It fully resembles a real one: same instruments, technical tools and live market conditions. As soon as you feel confident enough, you’re welcome to open a real account.
But please note that trading CFDs with the multiplier can be risky and can lead to losing all of your invested capital.
Let's sum up with the most commonly asked questions about the Parabolic SAR indicator.
FAQ
What is a Parabolic SAR Buy Signal?
A formation of three dots below the candlesticks allows you to open a buy position.
How Do You Read a Parabolic SAR Indicator?
If the indicator forms at least three dots in the same direction, it signifies the confirmed trend. Dots below candlesticks signal an uptrend, dots above notify about the downtrend.
What Are the Best Parabolic SAR Settings?
Fortunately for the trader, you can use standard settings: a step of 0.02 and a maximum of 0.2.
How Do You Use Parabolic SAR Effectively?
Use the indicator on big timeframes for a confirmation of the current trend.
What Does the Parabolic SAR Do?
The Parabolic SAR is used to define the trend direction, entry and exit points with possible market reversals.
Disclaimer: The information in this article is not intended to be and does not constitute investment advice or any other form of advice or recommendation of any sort offered or endorsed by Libertex. Past performance does not guarantee future results.
Why trade with Libertex?
- Get access to a free demo account free of charge.
- Enjoy technical support from an operator 5 days a week, from 9 a.m. to 9 p.m. (Central European Standard Time).
- Use a multiplier of up to 1:30 (for retail clients).
- Operate on a platform for any device: Libertex and MetaTrader.