
Crude Oil Price Forecast 2026-2030: Expert Predictions and Market Analysis
Prepared by the Libertex team
Content reviewed internally in accordance with regulatory standards.
According to LongForecast analysis, Brent crude oil is projected to trade in the $55-$67 range through the second half of 2026, following a spring peak earlier in the year, with the price closing the year around $65.87 in December. The 2030 oil price outlook shows prices potentially declining to $40-$55 per barrel.
The crude oil price prediction for the coming years depends heavily on OPEC+ production policies, shale oil output from the United States, and global economic growth trajectories. WTI crude oil follows similar patterns, with analysts projecting prices between $53 and $132 throughout 2026, though these forecasts remain subject to significant geopolitical and macroeconomic uncertainties.
The oil market continues to demonstrate why crude remains the world's most strategically important commodity. Despite accelerating energy transition discussions, petroleum still accounts for approximately 31% of global primary energy consumption. Current supply-demand dynamics show OPEC managing production cuts to support prices, while US shale oil producers respond rapidly to price signals, creating an effective price ceiling. Global demand growth, driven primarily by emerging markets in Asia, offsets gradual declines in developed economies. This crude oil forecast examines monthly predictions through 2029 and long-term scenarios to 2037, providing traders and investors with comprehensive crude oil analysis for informed decision-making.
Crude Oil Price Chart
The current Brent crude oil price stands at approximately 78.96$ per barrel. For comprehensive crude oil analysis, it's essential to examine both short-term market movements and long-term structural trends affecting oil supply and oil demand.
Crude Oil Price Forecast 2026
The oil price 2026 outlook is shaped by several key factors: OPEC+ production strategy adjustments, global demand growth from emerging markets (particularly China and India), and the pace of energy transition policies in developed economies. According to LongForecast, Brent crude forecast for 2026 shows prices ranging between $52.78 and $98.99, with significant seasonal variations.
Available data covers June through December 2026. Prices open at $67.16 in June and decline through Q3, reaching a trough of $55.56 in September. Q4 brings a partial recovery as markets stabilise, with the year closing around $65.87.
| Month | Low-High (USD) | Close (USD) | Change from 19.06.2026 |
| June 2026 | 63.55-98.99 | 67.16 | -14.9 |
| July 2026 | 55.49-72.24 | 63 | -20.2 |
| August 2026 | 56.14-63 | 59.09 | -25.1 |
| September 2026 | 52.78-59.09 | 55.56 | -29.6 |
| October 2026 | 55.56-61.95 | 59 | -25.2 |
| November 2026 | 58.92-65.12 | 62.02 | -21.4 |
| December 2026 | 62.02-69.16 | 65.87 | -16.5 |
Source: LongForecast (19.06.2026)
Crude Oil Price Forecast 2027
The oil price 2027 forecast reflects medium-term dynamics including upstream investment cycles that typically lag price signals by 3-5 years, shale oil productivity trends, and evolving energy transition policies. According to LongForecast, Brent crude forecast for 2027 shows a more contained pattern with prices ranging from $52.98 to $68.78.
Investment decisions made during low-price periods may begin affecting supply capacity by 2027. The oil price forecast opens the year around $65.24 in Q1, with prices holding in the $59-$66 range through Q2. The second half sees a modest peak of $65.50 in August before softening into year-end. The year-end price of oil may settle around $61.42.
| Month | Low-High (USD) | Close (USD) | Change from 19.06.2026 |
| January 2027 | 61.98-68.5 | 65.24 | -17.3 |
| February 2027 | 58.58-65.24 | 61.66 | -21.9 |
| March 2027 | 56.84-62.82 | 59.83 | -24.2 |
| April 2027 | 56.49-62.43 | 59.46 | -24.6 |
| May 2027 | 52.98-59.46 | 55.77 | -29.3 |
| June 2027 | 55.77-62.19 | 59.23 | -24.9 |
| July 2027 | 59.23-65.82 | 62.69 | -20.6 |
| August 2027 | 62.23-68.78 | 65.5 | -17 |
| September 2027 | 58.37-65.5 | 61.44 | -22.1 |
| October 2027 | 59.69-65.97 | 62.83 | -20.4 |
| November 2027 | 57.01-63.01 | 60.01 | -24 |
| December 2027 | 58.35-64.49 | 61.42 | -22.2 |
Source: LongForecast (19.06.2026)
Crude Oil Price Forecast 2028
The oil price 2028 forecast carries increased uncertainty as longer time horizons introduce more variables. The crude oil price prediction for this period depends heavily on whether economic growth continues, how quickly the energy transition accelerates, and whether supply constraints from underinvestment materialise. According to LongForecast, prices may range from $50.38 to $67.06 throughout 2028.
The forecast pattern shows initial strength in Q1 with prices opening around $63.87 in January before easing to $62.01 in February and recovering to $63.82 in March. Q2 sees a meaningful decline as prices fall toward $56-$60. A partial recovery in Q3-Q4 brings prices back toward the $55-$59 range, with the year closing at $59.42. Supply constraints from natural oil well decline rates and reduced upstream investment could support prices, while recession risks present downside scenarios.
| Month | Low-High (USD) | Close (USD) | Change from 19.06.2026 |
| January 2028 | 60.68-67.06 | 63.87 | -19.1 |
| February 2028 | 58.91-65.11 | 62.01 | -21.4 |
| March 2028 | 60.63-67.01 | 63.82 | -19.1 |
| April 2028 | 56.87-63.82 | 59.86 | -24.1 |
| May 2028 | 53.78-59.86 | 56.61 | -28.3 |
| June 2028 | 52.95-58.53 | 55.74 | -29.4 |
| July 2028 | 53.7-59.36 | 56.53 | -28.4 |
| August 2028 | 50.38-56.53 | 53.03 | -32.8 |
| September 2028 | 50.9-56.26 | 53.58 | -32.1 |
| October 2028 | 52.92-58.5 | 55.71 | -29.4 |
| November 2028 | 54.06-59.76 | 56.91 | -27.9 |
| December 2028 | 56.45-62.39 | 59.42 | -24.7 |
Source: LongForecast (19.06.2026)
Crude Oil Price Forecast 2029
The oil price 2029 projections are highly speculative and should be viewed as directional estimates rather than precise targets. Long-term structural factors, including peak oil demand scenarios, production capacity evolution and geopolitical realignment, will determine actual outcomes. According to LongForecast, the crude oil forecast shows potential price declines to the $47.50-$62.03 range.
The oil price prediction for 2029 suggests continued downward pressure, potentially reflecting either successful energy transition progress or persistent oversupply. Q1 shows relative weakness with prices opening around $56.35 before declining further to $50.00 by March. Q2-Q3 offers a modest recovery, with prices peaking at $59.08 in July, before softening again in Q4. The year closes around $53.98.
| Month | Low-High (USD) | Close (USD) | Change from 19.06.2026 |
| January 2029 | 53.53-59.42 | 56.35 | -28.6 |
| February 2029 | 50.64-56.35 | 53.3 | -32.5 |
| March 2029 | 47.5-53.3 | 50 | -36.6 |
| April 2029 | 50-55.76 | 53.1 | -32.7 |
| May 2029 | 51.21-56.61 | 53.91 | -31.7 |
| June 2029 | 53.91-60.11 | 57.25 | -27.4 |
| July 2029 | 56.13-62.03 | 59.08 | -25.1 |
| August 2029 | 52.65-59.08 | 55.42 | -29.8 |
| September 2029 | 52.96-58.54 | 55.75 | -29.3 |
| October 2029 | 50.37-55.75 | 53.02 | -32.8 |
| November 2029 | 50.04-55.3 | 52.67 | -33.3 |
| December 2029 | 51.28-56.68 | 53.98 | -31.6 |
Source: LongForecast (19.06.2026)
Long-Term Oil Price Prediction 2030-2037
Important Disclaimer: Ultra-long-term oil price forecasts are subject to extreme uncertainty and should be viewed as scenario-based projections rather than reliable predictions. Actual outcomes will depend on technological developments, government policies, geopolitical events and energy transition progress that cannot be accurately predicted years in advance.
The oil price 2030 and beyond depends on fundamental megatrends: the peak oil supply vs peak demand debate, fossil fuel investment trajectories and emerging market development patterns. The EIA presents multiple scenarios: a high-price path (supply constraints, slow transition) could see prices above $100, while a low-price path (rapid transition, demand destruction) might keep prices below $50 for decades. According to CoinPriceForecast, the reference scenario suggests a year-end price of $222.19 by 2030, with a mid-year level of $217.83, representing a projected change of +192% from the publication baseline.
Fossil fuels currently account for approximately 80% of global energy consumption, and even aggressive energy transition scenarios suggest petroleum will remain significant through 2037. However, peak oil demand may occur before supply constraints become binding, fundamentally altering long-term price dynamics.
| Year | Mid-Year (USD) | Year-End (USD) | Change from 19.06.2026 |
| 2026 | 89.81 | 130.22 | 71 |
| 2027 | 152.52 | 161.16 | 112 |
| 2028 | 168.99 | 171.31 | 125 |
| 2029 | 190.83 | 212.3 | 179 |
| 2030 | 217.83 | 222.19 | 192 |
| 2031 | 231.99 | 249.39 | 228 |
| 2032 | 249.67 | 260.03 | 242 |
| 2033 | 275.63 | 291.13 | 283 |
| 2034 | 298.9 | 313.85 | 313 |
| 2035 | 328.72 | 329.62 | 334 |
| 2036 | 343.75 | 357.81 | 371 |
| 2037 | 368.44 | 382.26 | 403 |
Source: CoinPriceForecast (19.06.2026)
Technical Analysis of Oil Price
When determining whether to buy or sell oil, it's crucial to create a technical analysis. We'll show you the top technical indicators to include in crude oil analysis, presented alongside an example.
Oil-Specific Considerations:
The oil market also requires understanding futures curve structures:
- Contango: Future prices higher than spot prices (typical in oversupplied markets)
- Backwardation: Spot prices higher than futures (typical in supply-constrained markets)
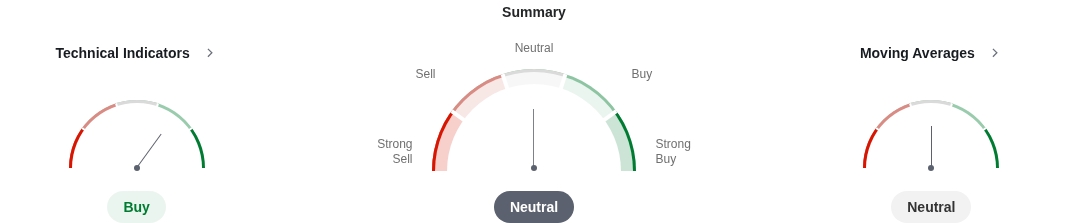
Current Technical Summary
| Indicator | Value | Signal |
| RSI(14) | 50.07 | Neutral |
| STOCH(9,6) | 48.07 | Neutral |
| STOCHRSI(14) | 35.31 | Sell |
| MACD(12,26) | 2.87 | Buy |
| ADX(14) | 16.67 | Neutral |
| Williams %R | -69.28 | Sell |
| CCI(14) | 54.02 | Buy |
| ATR(14) | 15.47 | High Volatility |
| Highs/Lows(14) | 0 | Neutral |
| Ultimate Oscillator | 59.09 | Buy |
| ROC | 25.73 | Buy |
| Bull/Bear Power(13) | 10.5 | Buy |
Source: Investing (19.06.2026)
Moving Averages:
| MA | Simple | Signal | Exponential | Signal |
| MA5 | 95.25 | Sell | 88.56 | Sell |
| MA10 | 80.16 | Sell | 84.36 | Sell |
| MA20 | 75.34 | Buy | 80.17 | Sell |
| MA50 | 81.43 | Sell | 77.24 | Buy |
| MA100 | 73.13 | Buy | 77.29 | Buy |
| MA200 | 78.06 | Buy | 70.35 | Buy |
Source: Investing (19.06.2026)
Pivot Points:
| S3 | S2 | S1 | Pivot | R1 | R2 | R3 | |
| Classic | 60.04 | 75.74 | 83.9 | 99.6 | 107.76 | 123.46 | 131.62 |
| Fibonacci | 75.74 | 84.85 | 90.49 | 99.6 | 108.71 | 114.35 | 123.46 |
| Camarilla | 85.49 | 87.68 | 89.86 | 99.6 | 94.24 | 96.42 | 98.61 |
| Woodie | 56.26 | 73.85 | 80.12 | 97.71 | 103.98 | 121.57 | 127.84 |
| DeMark | - | - | 79.81 | 97.56 | 103.67 | - | - |
Source: Investing (19.06.2026)
Important Limitation: Technical analysis works best in normal market conditions. During major fundamental events (geopolitical crises, OPEC announcements, economic shocks), technical levels frequently break down. Always combine technical signals with fundamental crude oil analysis.
What Is Crude Oil?
Crude oil is a fuel source in liquid form that can be found underground and extracted by drilling. Oil has many uses, including plastic and petroleum production, transportation, heat and electricity generation.
Because of oil's origins, it's considered a "fossil fuel". Simply put, crude oil began to be created hundreds of millions of years ago when plankton and prehistoric algae settled at the bottom of the ocean. The organic matter was covered with mud and layers upon layers of sediment, and the resulting pressure heated the remains. For millions of years, the matter formed kerogen (a waxy substance), and after even more heat and pressure, it transformed into liquid oil.
Crude oil is a non-renewable resource. When the world's current oil supply is used up, it'll take millions of years to create more oil.
Crude Oil Types
Petroleum consists of a complex mixture of hydrocarbons with varying molecular weights, and its quality varies significantly based on geographical origin. The industry classifies crude oil using two primary characteristics: API gravity (density) and sulphur content.
API Gravity Scale:
- Light crude: API gravity above 31.1° (less dense, more valuable for gasoline production)
- Medium crude: API gravity between 22.3° and 31.1°
- Heavy crude: API gravity below 22.3° (more dense, requires more refining)
Sulphur Content:
- Sweet crude: Less than 0.5% sulphur (easier to refine, commands premium prices)
- Sour crude: Greater than 0.5% sulphur (requires additional processing)
West Texas Intermediate (WTI) crude oil is lightweight (approximately 39.6° API) and has little sulphur (0.24%). As such, it's high-quality and is often called "light, sweet" oil. Its properties make WTI crude oil ideal for producing gasoline, which is why it's the United States' standard for crude oil.
Brent Crude combines crude oil from over a dozen oil fields in the North Sea. With an API gravity of approximately 38° and 0.37% sulphur content, Brent crude oil is slightly heavier than WTI but still classified as light, sweet crude. It's the global benchmark, pricing approximately two-thirds of the world's internationally traded crude oil supplies.
Other notable global varieties include:
- Dubai/Oman crude: Medium sour crude serving as the benchmark for Persian Gulf exports to Asia
- Nigerian Bonny Light: High-quality light sweet crude (33-35° API)
- Venezuelan heavy crude: Dense, high-sulphur crude requiring specialised refineries
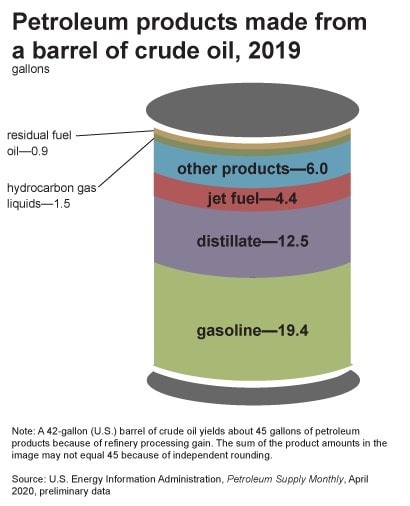
A Closer Look at Crude Oil Usage
Crude oil has many uses. It's the base for gasoline, jet and diesel fuels. Furthermore, crude oil is the base for petroleum products, including paraffin wax, tar, asphalt and lubricating oils. Oil's use can even stretch as far as perfume, fertiliser, soap, vitamin capsules and insecticides.
While pretty much every country depends on oil, only a handful produces it. The top 5 countries that have the most oil are the US (17.9%), Saudi Arabia (12.4%), Russia (12.1)%, Canada (5.9%) and Iraq (5%).
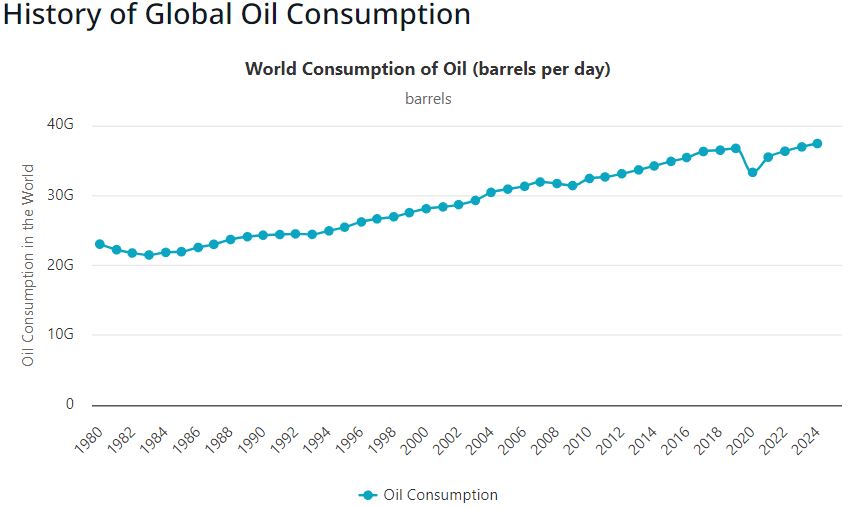
Global oil consumption has risen steadily year to year over the last three decades. The only decline was during the financial crisis of 2008 and the COVID-19 crisis of 2020.
4 Factors Influencing Oil's Price
Due to unexpected changes to the factors that affect oil prices, this commodity has become highly volatile. Later, we'll take a look at how exactly crude oil's price performed in 2020, but first, we'll introduce four key factors that have had a significant impact on this black gold.
Diminishing Global Demand
The EIA estimates that global demand for oil and liquid fuels continues to grow, albeit at a slowing pace. Oil demand from OECD countries has largely plateaued, while emerging markets — particularly China and India — drive incremental growth. The energy transition and increased electric vehicle adoption create uncertainty about future demand trajectories.
Rising Production in the US
US producers of alternative fuels and shale oil have increased their supply. It has been gradual, with supply increasing slowly since 2015. Shale oil producers have found ways to extract oil more efficiently, mainly by keeping wells open and reducing the cost of capping.
In August 2018, the US became the largest oil producer in the world. The next year, US crude oil production exported more oil than it imported for the first time since 1973.
Decreasing OPEC's Clout
While US shale producers have increased their market influence, they don't operate in OPEC's cartel-like manner. OPEC hasn't cut their output enough to support prices. The leader of OPEC, Saudi Arabia, desires higher oil prices, as that is where its government gets revenue from. However, this is offset by losing its market share to Russian and US companies. Furthermore, Saudi Arabia doesn't want to lose its market share to its archrival Iran.
Increasing Dollar Value
The value of the dollar has been driven up by FX traders ever since 2014. In times of economic distress, many traders consider the US dollar to be a safe haven. For instance, from 2013 to 2016, the dollar's value increased as a response to Brexit and the Greek debt crisis. And the coronavirus pandemic caused the dollar to increase in value from 3 to 23 March 2020.
So, how does this affect oil? All oil transactions are made in USD, and most oil-exporting countries maintain their currencies' value at a fixed exchange rate to USD. As such, a 25% rise in the dollar's value comes along with a 25% decline in oil prices.
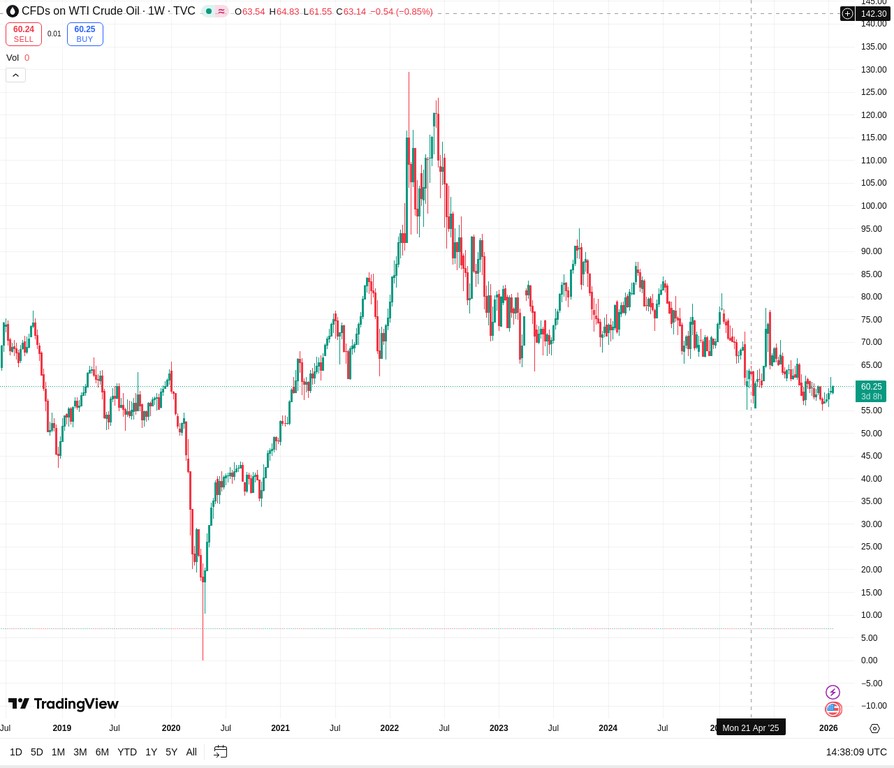
Crude Oil Price History
Over the last decade, the price of crude oil has been especially volatile. Crude oil is one of the most scrutinised commodity prices. Its cost influences all stages of production and, therefore, alters the price of end-products, as well.
Oil's inherent inelasticity with regard to short-term changes in supply and demand means that its prices are naturally erratic. What's more, the economic growth in BRIC countries (like India and China) and the use of horizontal drilling and hydraulic fracturing in the US have caused further changes to supply and demand, thus contributing to the heightened price volatility since 2009. In recent years, the global pandemic, geopolitical conflicts, and coordinated actions by OPEC+ have added to these factors.
The chart below shows the fluctuations in the price of WTI crude oil over the past five years, reflecting the recent market turbulence.
Key World Market Oil Events (2020-2025)
- 2020: The global COVID-19 pandemic and the price war between Saudi Arabia and Russia led to a sharp drop in demand. On 20 April 2020, the price of WTI crude oil reached a negative value for the first time in history at -$37.63 per barrel.
- 2022: The conflict in Ukraine in February caused a sharp spike in prices, with Brent crude exceeding $130 per barrel. In response, G7 countries and the EU introduced a price cap on Russian oil.
- 2023: The year was characterised by high volatility. Prices rose on the back of OPEC+ production cuts, reaching highs since 2022 in September (WTI: $95; Brent: $97), but then declined for seven consecutive weeks towards the end of the year due to concerns about global economic growth.
- 2024: Houthi attacks on ships in the Red Sea and the ongoing conflict in Ukraine maintained market tension. Nevertheless, the year ended with the second consecutive annual price decline. Brent finished the year at $74.64, and WTI at $71.72.
- 2025: The year saw a significant price drop, the sharpest since 2020. Brent and WTI lost about 20% of their value, ending the year at $60.85 and $57.42, respectively. The main reasons were an oversupply, record production in the US (up to 13.6 million barrels per day), and slowing demand in China.
How Is Oil Performing Now?
2025 was a tough year for the oil market. Despite geopolitical tensions, including sanctions against Russia and conflicts in the Middle East, the dominant factor was the excess of supply over demand. The average oil price in 2025 was about $69 per barrel, the lowest in five years when adjusted for inflation.
At the beginning of 2026, prices remain under pressure. Forecasts from leading energy agencies, such as the EIA, indicate a continued supply glut and sluggish demand in the near term, which could lead to further price declines throughout the year. The market is closely watching the policies of the new US administration, the decisions of OPEC+, and the economic situation in China, which will be the key price drivers in 2026.
What to Do With Crude Oil: Trade or Invest?
Just as with any other market, there is no guarantee of profit when you invest in oil. Because of its often-fluctuating prices, crude oil is a very risky asset. Therefore, before making an investment decision, be sure to check out the latest expert opinions, market trends, and technical analysis. To build any trading strategy, it's crucial to inform yourself about economic goings-on as deeply as possible.
But what if you aren't ready to make a long-term investment commitment? With CFDs, you can make trades on the crude oil market in a shorter timeframe without waiting for years. With the Libertex Trading Platform, you can get started trading WTI and Brent Crude Oil CFDs.
FAQ
Will oil prices go up in 2026?
According to LongForecast, Brent crude oil may see prices ranging from approximately $52.78 to $98.99 through the second half of 2026, with the year closing around $65.87. However, forecasts depend on OPEC+ decisions, global demand trends, and geopolitical developments.
What will oil be worth in 5 years?
The oil price 2030 outlook varies significantly by source. LongForecast projects prices declining further from 2026 levels, with the 2029 year-end estimate around $53.98, while CoinPriceForecast suggests a year-end level of $222.19. The wide range reflects uncertainty about the energy transition pace and oil demand trajectories.
Will oil reach $150 a barrel?
While not impossible during supply disruptions or geopolitical crises, sustained $150 oil would likely trigger demand destruction and accelerate energy transition investments. The EIA's high-price scenario suggests prices could exceed $175 by 2050 under supply-constrained conditions.
Is crude oil a good investment for 2026?
According to current crude oil forecasts, 2026 shows a potential price range of $52.78-$98.99 for Brent through year-end, with a projected year-end close around $65.87. Whether this represents a good oil investment depends on your entry price, risk tolerance and investment horizon. Oil remains highly volatile, and past performance doesn't guarantee future results.
What factors affect oil prices the most?
The primary factors influencing oil prices include: OPEC+ production decisions, US shale oil output, global demand (particularly from China), dollar strength, geopolitical events affecting supply routes and refinery capacity utilisation.
Will electric vehicles kill oil demand?
Electric vehicles will impact gasoline demand over time, but petroleum serves many uses beyond transportation fuels. The IEA suggests global oil demand could peak before 2030 under aggressive EV adoption scenarios, but complete displacement would take decades.
What is the difference between Brent and WTI?
Brent crude oil is the global benchmark, sourced from the North Sea (38° API, 0.37% sulphur). WTI crude oil is the US benchmark, lighter and sweeter (39.6° API, 0.24% sulphur). WTI typically trades at a discount to Brent due to inland transportation costs and higher US production.
Will oil prices ever recover?
Not only may oil prices recover, but they could potentially reach new highs by 2050, depending on which global oil market scenarios play out. The EIA suggests prices could exceed $175 under supply-constrained conditions.
Can oil go up?
Political unrest, OPEC production cuts, growing scarcity and strong global demand could all cause the price of oil to rise. Geopolitical risks affecting the Strait of Hormuz or other critical oil tanker routes could trigger significant price spikes.
How can I buy a barrel of oil?
While you can buy a barrel of oil physically, you'd need to access the spot market for physical goods. Most traders prefer financial instruments: CFDs for short-term trading, futures for professional hedging or ETFs for passive exposure.
Disclaimer: The information in this article is not intended to be and does not constitute investment advice or any other form of advice or recommendation of any sort offered or endorsed by Libertex. Past performance does not guarantee future results.
Why trade with Libertex?
- Get access to a free demo account free of charge.
- Enjoy technical support from an operator 5 days a week, from 9 a.m. to 9 p.m. (Central European Standard Time).
- Use a multiplier of up to 1:30 (for retail clients).
- Operate on a platform for any device: Libertex and MetaTrader.