
Pivot Points: Find Support and Resistance Levels
Prepared by the Libertex team
Content reviewed internally in accordance with regulatory standards.
The concept of support and resistance levels is one of the central points in trading. These levels help investors identify price reversals and entry and exit points for trades. By knowing the support and resistance points, you can build an effective strategy.
However, support and resistance are subjective, so traders apply indicators to draw them correctly. Pivot points are one of the most reliable ways to set the perfect support and resistance levels.
Pivot Point: Definition
A pivot point is a technical indicator used to identify support and resistance levels as well as clarify the market trend. This instrument is calculated on the close, high and low prices of the period prior to the timeframe.
A pivot point is a technical indicator used to define support and resistance levels as well as clarify the market trend.
Unlike other tools, it wasn't invented by one person but by a group of floor investors. They took the previous day's high, low and close prices to determine the current day's pivot point.
Pivot Points: Structure
The pivot point indicator consists of several horizontal lines, the number of which depends on the type of instrument and varies from 5 to 10. Later, we'll explain the types of pivot levels. Because a pivot point is a trend indicator, it's used directly on the price chart, such as in the image below.
Pivot points consist of support, resistance and central lines.
No matter what type of pivot points you use, there are always support, resistance and central lines. The price moves around these points most of the time and is expected to consolidate near them as they work as a boundary for future movements.
The central pivot point is located between the equal number of support and resistance levels, serving as a barrier. It's a crucial point used to determine the market trend.
Pivot Points Indicator in MetaTrader 4
Although traders widely use the pivot point tool, it's not used by default in MetaTrader. That's why you'll need to download this tool from the Internet if you want to use it.
The pivot point tool is not used by default in MetaTrader.
When you download the indicator, insert it in MetaTrader. Doing so requires several steps that will differ from standard steps.
Click 'File' in the upper tab of the platform's window, then 'Open Data Folder'. Find the MQL4 folder that contains the 'Indicators' folder and paste the downloaded indicator there.
As soon as you do these steps, restart the MetaTrader platform. After that, click 'Insert' – 'Indicators', choose the 'Custom' tab and find the pivot point tool. It's worth mentioning that any other indicator you download from the Internet should be set the same way.
Pivot Points: Types and Calculations
There are different types of indicators, and the calculation method varies depending on the type. Although the pivot points indicator isn't a standard instrument in MetaTrader, it doesn't mean traders have to calculate the levels themselves. The calculation is done automatically.
However, if you want to understand how the instrument works, you should know how it's built. Moreover, the differences between the types will become clearer if we highlight the differences in how they're calculated.
Classic Pivot Points
Let's start with classic pivot points. This type consists of five levels and can be called a five-point system. To calculate the levels, we need to take the high, low and close prices of the previous trading day.
First, we calculate the central pivot point. To get its value, we should find the sum of the high, low and close prices and divide the result by 3.
| Pivot Point (or PP) = (High + Low + Close)/3 |
Knowing the central line, we can get both support and resistance levels.
The first support line results from the subtraction of the previous high from the doubled central pivot point.
| Support 1 (or S1) = (PP x 2) – Previous High |
To find the second support, you need to subtract the previous low price from the previous high one. After that, subtract the result from the central line.
| Support 2 (or S2) = PP – (Previous High – Previous Low) |
The formula for resistance levels is almost the same. To find the first resistance, you need to subtract the previous candlestick's low price from the doubled central pivot.
| Resistance 1 (or R1) = (PP x 2) – Previous Low |
The second pivot will be calculated as a sum of the central pivot and the subtraction of the previous low and high prices.
| Resistance 2 (or R2) = PP + (Previous High – Previous Low) |
It's also possible to include the opening price in the formula, which looks like this:
| PP = ((Open of Today) + Yesterday's (High + Low + Close)) / 4 |
Support and resistance points are calculated the same as explained above.
It's the easiest way to get pivot points. However, there are other methods that are used in specific trading strategies. Let's look at how the calculations vary.
Woodie Pivot Points
If you need to add additional weight to the last prices, you better use Woodie pivots.
This type consists of five levels as well. Firstly, you should calculate the central point. The central pivot looks like a sum of high, low and doubled close prices divided by four.
| PP = (High + Low + 2Close) / 4 |
The first resistance level is the subtraction of the low price from the doubled central pivot.
| R1 = (2 X PP) – Low |
The second resistance results from the subtraction of the low price from the sum of the central point and high price.
| R2 = PP + High – Low |
The support levels are calculated as follows:
The first support is a subtraction of the high price from the doubled central pivot.
| S1 = (2 X PP) – High |
The second level will be a sum of the low price and subtraction of the high price from the main pivot level.
| S2 = PP – High + Low |
Camarilla Pivot Points
As we said above, pivots vary in number. For example, the Camarilla type is presented by eight levels. To calculate them, you need a specific coefficient. Moreover, it's not necessary to start a calculation with the middle line. The formula for all the resistance and support levels is similar. The only difference is the coefficient.
You need to multiply the difference between the high and low prices by a coefficient and sum the result with the close price for all resistance levels.
| R4 = C + ((H-L) x 1.5000) |
| R3 = C + ((H-L) x 1.2500) |
| R2 = C + ((H-L) x 1.1666) |
| R1 = C + ((H-L) x 1.0833) |
To get support levels, you need to multiply the difference between the high and low prices by a coefficient. The next step is to subtract the result from the close rate.
| S1 = C – ((H-L) x 1.0833) |
| S2 = C – ((H-L) x 1.1666) |
| S3 = C – ((H-L) x 1.2500) |
| S4 = C – ((H-L) x 1.5000) |
The central line is calculated as follows. You need to add up the high, low and close prices and divide the result by 3.
| PP = (H + L + C) / 3 |
Although all the levels are significant, you should pay attention to the third and fourth supports/resistances. One of the strategies recommends trading against the trend when the price rebounds from the third level. The Stop-Loss can be located near the fourth pivot. If the price breaks the fourth level, you're supposed to trade within the current trend.
Fibonacci Pivot Points
As you can discover from the type's name, the calculation is based on Fibonacci retracements. This type has seven lines, and its calculation starts with the central pivot level. To get it, you need to divide the sum of the high, low and close prices by three.
| PP = (H + L + C) / 3 |
The resistance levels are calculated as the sum of the central pivot and the result of the following calculations. You need to multiply the difference between the high and low prices by the coefficient (similar to Fibonacci levels).
| R3 = PP + ((High – Low) x 1.000) |
| R2 = PP + ((High – Low) x 0.618) |
| R1 = PP + ((High – Low) x 0.382) |
The support levels have the same formula as resistance pivots, but you need to take not the sum but the difference between high and low prices.
| S1 = PP – ((High – Low) x 0.382) |
| S2 = PP – ((High – Low) x 0.618) |
| S3 = PP – ((High – Low) x 1.000) |
Pivot Point Indicator: Settings
Usually, we don't focus on the settings of the indicators. They can vary significantly and don't require a lot of information about them.
Using pivot points, you should consider the period of them as it affects the levels the indicators will present. Usually, you can choose from daily, weekly, monthly and yearly levels.
The period of the indicator doesn't change until it ends. For instance, the levels of the weekly pivots won't change until the next day.
You may wonder why we don't have pivots for smaller timeframes, but the levels are tricky. If you want to apply the indicator on the 30-minute chart and smaller ones, you should apply daily pivots. Weekly levels are usually used on hourly, four-hour and daily charts. When trading on monthly charts, you better use the weekly pivots. And for monthly charts, it's possible to set yearly pivots.
There's another crucial point you should know about. If you apply weekly levels, for instance, they won't change until the next week starts. The same rule applies to all periods.
Pivot Points in Trading
The primary function of the pivot points in trade is to determine support and resistance levels. However, you can also use the tool to predict the market trend.
Support and Resistance Levels
We'll start with the key function: support and resistance levels. Range-bound traders widely use pivot levels. The strategy is simple: you need to open a buy trade when the price is near the support levels; you can open a sell position if the price is near the resistance points.
The more times the price touches the pivot point, the stronger the level is.
Pivot points are a perfect tool for pending orders. For instance, if you see the price is climbing towards the resistance level, you can place a sell limit order. Pivot points can help you set a Stop-Loss order, too. Just put this order several pips above the resistance. Usually, traders use a 5-10 pip Stop-Loss order. Nevertheless, the size depends on many factors, including the position size.
If you see the price is falling, you should place a buy limit order. A Stop-Loss order should be several pips below the support.
The support pivot turns into resistance when the price falls below it; the resistance pivot becomes support if the price breaks above it.
Breakout Levels
Breakout traders implement this technical tool on the chart to determine the levels that should be broken ahead of the future position.
For example, if you think there's a strong bullish market trend, you can wait until the asset jumps above the first resistance. Then you can open a buy position and place a Take-Profit order at the level of the next resistance. In this case, you can place a Stop-Loss order just below the first resistance. It's also possible to replace your Stop-Loss if you see the price moves in the direction you predicted.
The same strategy can be applied to the sell trade. Wait until the price breaks the support pivot upside down. You can place a Take-Profit order at the level of the second support. Stop-Loss can be set above the broken support level. You can also move the Stop-Loss regarding the price movements.
Although the strategy seems easy, there are pitfalls. It would be best if you were sure it's a breakout, not a fakeout. That's why you should use other indicators that can provide confirmation.
It's also worth checking the news and economic events. The market fluctuates significantly when there are important market events.
Trend
Pivot points indicator can be used to define the current market trend. Usually, when the price breaks below the central pivot, it's a sign of a downtrend. If the price is above the mid level, the market can be considered bullish. You should still bear in mind confirmation of the signal.
Pivot Points: Trade Examples
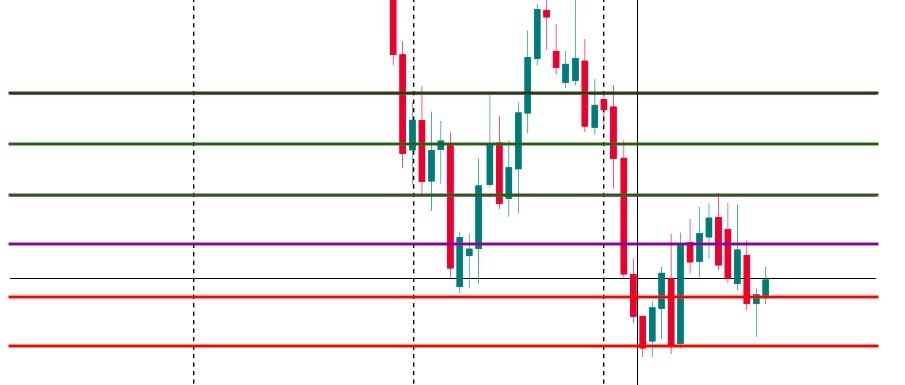
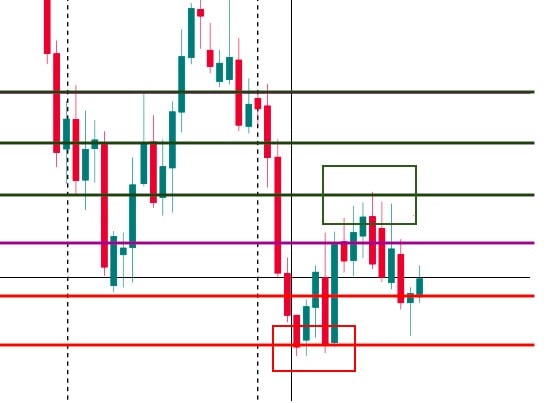
To better understand how the pivot points work, we'll show you an example of Forex trading. We applied the pivot levels on the price chart of the EUR/USD pair.
The price broke the central pivot (1), so we could open a sell position. The first Take-Profit could be placed on the first support level (2). After the breakout, we could either set the second Take-Profit level at the following pivot point (3) or close the trade at the first level and reopen it after the break. Still, you should remember that every time you open a trade, a broker takes a fee.
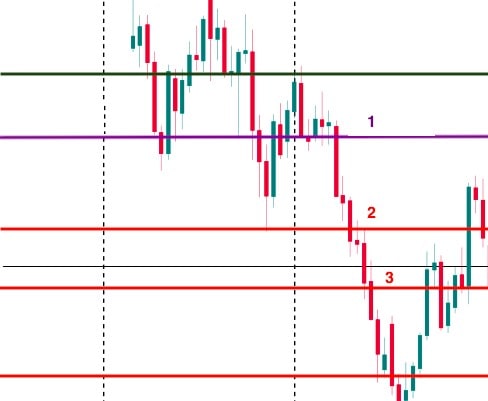
Usually, when the price breaks the first and second levels, we can expect it to touch the third one and subsequently rebound. It means the last Take-Profit point can be located on the third line. After that, you should close the trade, as there is a high chance the price will turn around.
Stop-Loss orders should be placed slightly above the previous levels if we talk about the sell trade. On the contrary, place Stop-Loss orders below the last level when there's a buy trade.
Sessions
We want to highlight a critical point in using this technical tool: market sessions. As you may know, during a 24-hour period, the market goes through four trading sessions: the Australian, Japanese, UK and American sessions.
An experienced trader knows that when a new trading session starts, market volatility increases as investors enter the market. It means the pivot levels can be easily broken. It would be best if you avoided trading on signals of pivot levels when the market opens.
At the opening of trading sessions, volatility increases. Thus, the pivot levels can be easily broken.
At the same time, you can enter the market with a range-bound strategy between the sessions because the market is anticipated to remain stable. The price is supposed to move in a range between two pivot levels.
Pivot Points: Strategies
We have already mentioned several methods you can use to trade on pivot points levels. We'd like to share yet another strategy.
This strategy will work for the London and US sessions.
- Step 1. Choose the asset you want to trade.
- Step 2. Open the trade at the session's opening. Choose the 15-minute timeframe.
- Step 3. After the first 15 minutes, see if the price breaks below the central pivot. If this happens, you may suppose the market will move down so that you can open a sell trade. However, if the price is too close to the first pivot support, we should open the trade.
- Step 4. A Stop-Loss order should be placed 5-10 pips above the central level.
- Step 5. You can place the first Take-Profit at the first support. If you're sure the downtrend is strong, it's possible to increase the Take-Profit order until the second support.
This strategy can be applied to both buy and sell positions.
Use Pivot Points in Your Favour
To use the indicator in your strategy effectively, you need to learn how to read its signals and know its strengths and weaknesses.
|
Advantages |
Limitations |
|
Easy to use. Pivot points can be easily applied to the chart and provide clear signals. |
Not a standard setting. The pivot point indicator isn't a standard indicator in MetaTrader. However, other trading platforms may have it by default. |
|
Plenty of signals. Besides one of the most significant functions — support and resistance levels — the indicator provides many other signs, such as the trend direction. |
Many types. Although it seems like an advantage that the indicator is presented in different ways, it isn't easy for beginner traders to choose the best type. |
|
Static. This is an advantage for long-term traders as the pivot points don't change during the day. |
Accuracy. As with any other indicator, pivot levels can provide false signals, especially on longer timeframes. If you remember, we previously said the indicator changes depending on the period you choose. Daily pivots will change every day, while weekly pivots will move only once a week. |
|
Simple calculation. Even if you want to calculate the levels yourself, you can easily do that if you know several figures. |
Tip for Traders: Avoid Mistakes
We want to share some tips that will help you avoid the most common mistakes when using the pivot points indicator.
- Combination. We always recommend combining an indicator with other tools such as other indicators or chart/candlestick patterns. However, pivot points can barely be combined with other tools. If you want to confirm the support or resistance levels, it's unlikely other tools can be used for confirmation.
If you need to find a supportive tool for a trend signal, you can apply trend indicators like Bollinger Bands or Parabolic SAR.
- Period. Although pivot points can be applied to different timeframes, you better avoid the highest ones, such as weekly, monthly and yearly. The levels change with a low frequency.
Conclusion
To conclude, the pivot points indicator is a useful tool that helps traders find support and resistance levels used in every trading strategy. Moreover, pivots can predict the market trend.
All of these things make pivot levels a necessary tool. Still, the indicator has limitations. That's why it's vital to practice before entering the real market. But please note that trading CFDs with leverage can be risky and can lead to losing all of your invested capital. To get your bearings before risking your money, you can open a free Libertex demo account. It allows you to trade standard currency pairs and CFD assets with all useful technical instruments.
Let's sum up our tutorial with answers to the most frequently asked questions about pivot points.
FAQ
What Is a Pivot Point in Forex?
A pivot point is a technical indicator that mostly serves to show the levels of support and resistance.
Which Pivot Points Are Best for Intraday Trading?
The daily pivot levels are the best for intraday trading.
What Is the Pivot Strategy?
If the price breaks below the central pivot, there's a chance the trend is bearish. So, you can place Take-Profit orders at the subsequent support levels. The opposite rule applies to a buy position.
Disclaimer: The information in this article is not intended to be and does not constitute investment advice or any other form of advice or recommendation of any sort offered or endorsed by Libertex. Past performance does not guarantee future results.
Why trade with Libertex?
- Get access to a free demo account free of charge.
- Enjoy technical support from an operator 5 days a week, from 9 a.m. to 9 p.m. (Central European Standard Time).
- Use a multiplier of up to 1:30 (for retail clients).
- Operate on a platform for any device: Libertex and MetaTrader.