
What Is a Bear Trap in Trading and How to Handle It?
What Is a Bear Trap, and Why Does It Happen?
As usual, weэll start with the definition. A bear trap is a market situation in which sellers expect the bearish movement to continue, but the market changes course.
A bear trap is a market situation in which traders expect downward movement to continue after a sudden support breakout, but the market changes course.
The price sharply declines and breaks the support level, which lures traders who believe the downtrend will continue. In that case, the investor might trail the take-profit level, for instance. However, the breakout turns out to be only temporary, and the market reverses course. If the trader misses this situation, he/she will definitely lose money.
The bear trap's key disadvantage is that it can happen during any timeframe and with any asset, including fiat currencies, cryptocurrencies, stocks, indices and CFDs. It's a big challenge for traders as they have to be cautious the entire time they trade.
Why Do Traps Happen?
There can be several reasons why a bear trap occurs on the chart. Of course, the major factor is the inability of bears to pull the price further down. But this inability occurs due to certain factors, as seen below:
The key reason is the weakness of bears due to certain market events.
- The first reason is unexpected positive events. In the category of unforeseen events, we can think of speeches by political leaders or influential economic actors. It's impossible to predict what politicians or financial leaders will say. If the market perceives their speeches as positive, the price will rise.
- Secondly, if a strong uptrend prevails in the market, there are high risks of a bear trap.
- The third reason is a long downtrend. The market is constantly changing direction. If the downward movement stays for long, it's unlikely to continue.
Bear Trap Trading Examples
Although the definition is simple, it's always better to look at real-market examples.

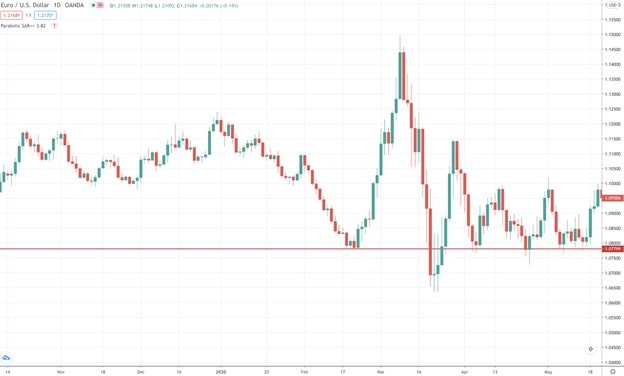
For instance, in this daily chart of the EUR/USD pair, the price broke below the support, but the downtrend didn't continue.
How to Identify a Bear Trap - Technical Analysis
A bear trap can trigger dramatic losses, but we're here to help you minimise risks while trading. Let's look at technical indicators that can signal a bear trap before you get caught up in the trap.
Volume
The volume indicator is one of the best tools that can signal a bear trap. The volume indicator shows how strong market participants are. Usually, a bear trap is reflected by low volume because bears aren't strong enough to pull the price down. As such, volume is supposed to be low.
Fibonacci Levels
Fibonacci levels are a perfect indicator for identifying price reversals. If you see that the market has turned around, you should apply Fibonacci retracement levels on the price chart. The trend reversal will be confirmed only if the price breaks one of the Fibonacci levels. Otherwise, it's a sign of a bear trap.
Divergence
There are several indicators that are used to provide divergence signals. The most famous and reliable ones are RSI, MACD, and Awesome Oscillator. If you don't know what divergence is, we'll give you a brief definition.
Divergence is a market situation in which the price and indicator go in different directions.
Divergence is really simple to use. All you need to do is check whether the indicator moves in the same direction as the price. If there's a divergence, then there's a high risk of a bear trap.
Bear Trap Chart Patterns
Technical indicators are reliable. However, there's another way to identify a bear trap: chart patterns.
Pattern #1: Price Action
If you're an experienced trader, you won't have difficulties identifying a bear trap by simply checking the price direction.
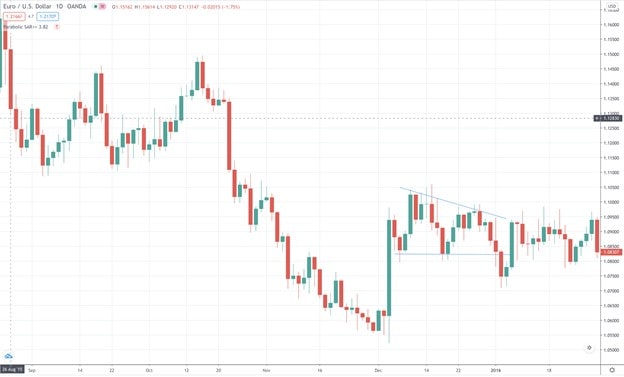
Look at the chart below. We have a descending triangle in which the price broke below the bottom line, which signals a continuation of the downtrend. However, the price had already fallen before. Why enter the market now if there's no clarity on how long the drop will continue?

If you see any reversal candlestick formation, such as a hammer, morning star, harami, or engulfing pattern, there will be an upward market reversal. As such, you should avoid opening a short trade.
Pattern #2: Support Retest
Imagine the price falls below the support level but turns around. It's early to think this is a bear trap because it can be just a short-term correction. Thus, you should wait until the price rises above the support (the level has already become a resistance). If this happens, the trend is anticipated to turn bullish. That means a support retest doesn't guarantee a bear trap. In this case, we have a non-classic bear trap in trading.
Pattern #3: Reversal Patterns
Examples of reversal patterns are the double bottom and the reversal head-and-shoulders patterns. The idea is simple: the pattern signals an upward movement. If you see a fully formed reversal pattern, you can't expect the market will keep falling. Any decline will likely become a trap.
Why It's Important to Avoid Bear Traps and How to Do It While Trading
Why avoid bear traps? The answer is clear: to avoid losing money. If you enter the market and a bear trap occurs, you can't predict the length of the downward movement or place a take-profit level. Furthermore, there's a risk that you'll simply miss the point of the market reversal.
Below, you can find several ways to avoid falling into a trap.
Method #1: Follow the Volume
To understand whether the downward movement is strong enough to continue, you should check the volume, which reflects the bears' strength. If the indicator doesn't show increased values, there's no point in entering the market because the chance is low that bears will have enough strength to pull the price further down after a support breakout.
Method #2: Trading Candlestick Patterns
Candlesticks provide one of the most reliable signals, which is why we highly recommend that you learn the most famous ones. In the previous part, we mentioned such patterns.
Reversal candlesticks and Doji candles should be considered signals of a bullish market direction.
If the market forms a reversal candlestick pattern after the downward breakout, there's almost no chance the decline will persist.
In addition to reversal candlesticks, you can consider the Doji candlestick pattern. This candlestick reflects market uncertainties. If there are doubts about the market's future direction, the Doji candlestick will follow the breakout.
Method #3: Too Late
Imagine the bear trap occurs within the downtrend. The main idea of the sell position is to sell at highs. Why sell within the downtrend? Such actions make sense only when the market forms a long-term downtrend, and you don't see any point in waiting until the market turns around.
How do you identify whether the trend has already formed or if there's a chance for a further decline? The length corresponds with the timeframe. For instance, an hourly price decrease is not a trend for big timeframes. It is, however, a trend for small ones.
Still, we recommend entering the market as soon as the price turns around, not after the trend has almost formed.
Method #4: Define Traps In Advance
Although it's not easy to identify a bear trap, it is possible. In the previous parts, we listed many ways to do that, so be careful and learn how to determine the bear trap. You can do that with a Libertex demo account. The account provides risk-free access to different markets and a whole range of tools that should be used to identify a bear trap.
Method #5: Limit Orders
The idea of a Sell Stop order is to open a short position when the support is broken. But what if the breakout is a trap? Limit orders aren't subject to the whims of the market. Traders place limit orders when they want to execute a trade in the future, not now.
So, if you do place a Sell Stop order, we recommend checking the market more often than you usually do.
How to Trade Bear Traps: the Best Trading Strategies
The bear trap is a tricky market situation that involves the potential of losing money. Still, if you know how to turn the situation in your favour, you have chances to come out ahead.
Trading Strategy #1
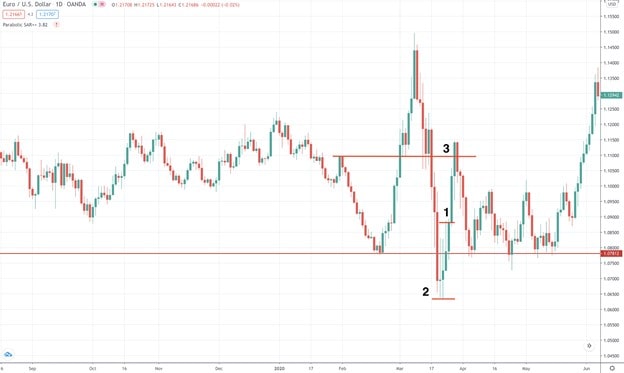
- Step 1. If you managed to identify a bear trap, you should wait for the formation of a bullish candlestick.
- Step 2. If the candlestick forms, you can place a Buy Stop limit order. The entry level is several pips above the bullish candlestick's high (1).
- Step 3. The Stop Loss level can be placed 3-5 pips below the bear trap candlestick's low (2).
- Step 4. There are two ways to measure the take-profit level. First, you can use a well-known risk/reward ratio. If you measure the Stop Loss distance, you should multiply it by 3. Second, you can find the previous resistance level and place the take-profit there (3).

Trading Strategy #2
If you trade, you can buy and sell a security without owning it. If a bear trap occurs, you should buy. This strategy is as simple as the previous one. The main idea is to buy when the bear trap is confirmed.
It sounds easy, but there's a crucial element: you must be sure it's a bear trap. Check the following steps:
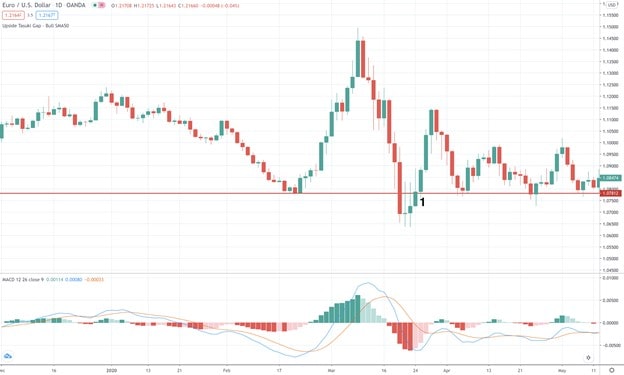
- Step 1. When the price breaks above the previous support, you should think about a long trade (1).
- Step 2. However, you shouldn't open the trade now. Instead, you should wait for a retest of the support after the trap. If the retest ends without a breakout, it's a sign of an uptrend.
- Step 3. We always talk about confirmations. Here, you can use candlestick patterns, for example, the bullish engulfing or hammer pattern. There are also such indicators as Awesome Oscillator or MACD. However, this time we decided to find an example that doesn't fit the conditions, so you see that not each situation works for the strategy.
If you're careful enough, you see that the MACD indicator doesn't signal a price reversal. There's also the Doji candlestick, which signals market uncertainty. - Step 4. The strategy should be used for a strong bullish trend. So, the take-profit level can be far off, or you can use trailing orders.
- Step 5. Remember about Stop Loss. It can be placed 3-10 pips below the previous resistance level, depending on the timeframe.

The Bear Trap in Trading: Trade or Avoid?
In this article, we've gathered the most relevant information about the bear trap. As you've learned, the bear trap is a risky situation that can affect your wallet. We recommend avoiding bear traps, but if you can't, you should learn how to handle them.
Of course, it's a bad idea to learn the ropes of this skill in the real market. That's why Libertex provides a demo account that provides a risk-free environment that helps you gain experience. You can select from a wide choice of instruments, for example, CFDs on assets like fiat currencies, stocks and cryptocurrencies.
FAQ
What Does the Bear Trap Mean in Trading?
A bear trap is a market situation in which traders expect downward movement to continue, but the market reverses back.
How Do You Know If It's a Bear Trap?
You'll understand that it's a bear trap if you see that the market breaks below the support but then turns around and starts rising.
How Do You Stop a Bear Trap?
A bear trap can't be stopped. However, you can predict it or trade it if you're already in the market.
Is the Market in a Bear Trap?
A bear trap can occur in any market and at any time. So, before answering this question, you should choose an asset to trade and see what's happening with it on the price chart.
Disclaimer: The information in this article is not intended to be and does not constitute investment advice or any other form of advice or recommendation of any sort offered or endorsed by Libertex. Past performance does not guarantee future results.
Why trade with Libertex?
- Get access to a free demo account free of charge.
- Enjoy technical support from an operator 5 days a week, from 9 a.m. to 9 p.m. (Central European Standard Time).
- Use a multiplier of up to 1:30 (for retail clients).
- Operate on a platform for any device: Libertex and MetaTrader.