ATR Indicator: Measuring Volatility
Prepared by the Libertex team
Content reviewed internally in accordance with regulatory standards.
Market volatility is one of the key factors that determine the success of your trades. In times of high volatility, the risk of loss rises significantly. If you're a newbie, you should avoid periods of significant volatility because it becomes complicated to predict the market direction. Moreover, there are many issues with stop-loss orders and take-profit levels.
That's why you need an instrument that will help you place a good trade. There are many indicators that predict the market direction, but only a few can define the strength of market fluctuations. Average True Range is one of them.
Average True Range: What Is It?
ATR or Average True Range is an oscillator that determines the range of market volatility. It means the indicator shows the average size of the trade within a certain period of time.
ATR or Average True Range is an oscillator that determines the range of market volatility.
ATR was created by J. Welles Wilder Jr. and presented in his book New Concepts in Technical Trading Systems. The Average True Range indicator is relatively young, first appearing in the book just in 1978. However, it's widely used by traders all over the world.
The author also developed famous technical tools that every trader uses in their strategies, such as the Relative Strength Index (RSI), Parabolic SAR and Average Directional Index.
As with any oscillator, the indicator's window is placed below the price chart. The Average True Range is presented by only one line that moves from bottom to top and back, showing the strength of market fluctuations.
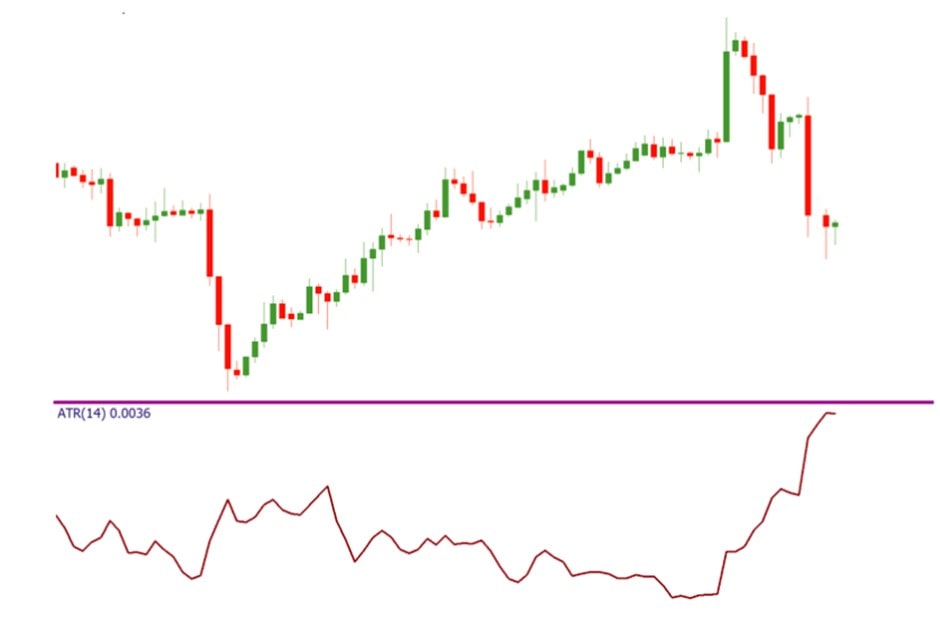
The most significant feature of the indicator every trader should know is that it doesn't show the market direction. The ATR tool's increase signals the rise in market fluctuations. If the ATR falls, the range of trades declines.
How to Place ATR in MetaTrader 4
The ATR indicator is set in MetaTrader by default. That means you don't have to download it from the Internet. You can just quickly apply it to the chart. To do so, click 'Insert' in the upper tab, then 'Indicators', choose 'Oscillators,' and 'ATR' will be on the list.
Fortunately, for beginner traders, this indicator doesn't have many settings you have to deal with. There's only the period. The default period is 14, but you can change it based on your trading strategy.
The smaller the period is, the more alerts the Average True Range provides. The larger the period is, the fewer signals it will submit.
As with any other indicator, a shorter period will lead to a surge in the number of signals the indicator offers. Nevertheless, you should be prepared for an increased risk of false calls, too. Inversely, if the period is larger, the number of alerts will decrease. This will help you filter out signs if you're a newbie, but you may lose some effective entry points.
Why ATR Is Effective
The Average True Range is one of a few indicators that can define market volatility. It's crucial for investors, especially for newbies. Volatility affects such important factors as stop-loss orders, exit points, and the size of a trade. Thus, traders either avoid trading in times of significant volatility or prepare for it.
The Average True Range is an uncommon indicator, but it's easy and provides simple signals any trader can read.
Moreover, the Average True Range tool is easy to use because it has only one setting. Also, the ATR provides signals any trader can read. Its one line and lack of crosses allow traders to catch signals fast.
Although there are other tools that show the power of price fluctuations, the Average True Range is a default instrument on different trading platforms. It can be applied to a chart in just a few clicks.
ATR: Calculating the Indicator
As with any other indicator, the Average True Range is set automatically. This means that a trader won't have to do any calculations. Still, if you want a deeper understanding of how the indicator works, you should learn how to calculate it. To measure the indicator, you need to consider the most recent high and low prices and the previous period's close price.
Calculation: Steps
- Subtract the current period's low price from the current period's high price.
- Subtract the previous period's close price from the absolute value of the current high price.
- Subtract the last period's close rate from the absolute value of the current low price.
- To finish the calculation and define the ATR value, you need to compare three figures and choose the largest one.
ATR Tool: How to Read Signals
Although the Average True Range is used to determine the strength of market volatility, it also provides the following other alerts.
Market Volatility
The primary function of the indicator is to identify market volatility. As the Average True Range consists of one line, we need to set the barrier that will separate high volatility from low volatility to determine its strength.
To do this, you can either draw a line by eye in the middle of the range or draw a moving average. Both will serve as an average line. If the indicator breaks above it, the volatility is high. If the ATR line is below the moving average or the middle line, the market is calm.
To set the moving average (MA) indicator, you can choose a significant period such as 100. The most crucial point here is to place the MA line on the indicator, not the price chart. This function is available in MetaTrader.
Envelopes are also a way to confirm the power of market fluctuations. If you apply the Envelopes indicator on the ATR one, you can use Envelopes as a measure of ATR movements. A break below Envelopes lines is a sign the market is calm. If the ATR is above the Envelopes, the candlesticks are big, so volatility is high.
Trend
It seems strange, but the Average True Range instrument can also be used to clear the market trend. Previously, we said that the indicator determines when the market is calm and when there's a trend. So, when the indicator rises, it's more likely that a trend is forming. But if the ATR falls, the market is consolidating.
The ATR can't predict the direction of the trend, but it can show its strength.
However, at the beginning of the article, we mentioned that the Average True Range is not an indicator that defines the market direction. That's why if you use it to decide where the market will move, you need to apply additional indicators that will confirm the market movements. We recommend using trend indicators such as Moving Average, Bollinger Bands and MACD. Chart patterns can also be used to define the market trend.
Another option to confirm the current trend is to place ATR indicators on several timeframes. For instance, you can use daily and hourly charts. If the instrument moves in the same direction on both timeframes and breaks the average line, it signals a trend.
Market Conditions
It's also possible to identify whether the market is continuing to rise. To do this, you need to check the average of the daily movement. If there's a note that the price has already passed the daily ATR movement, there's a chance that the market will fluctuate, but only if there's no significant news in the market.
Stop-Loss Orders
The ATR indicator can also be used to place stop-loss orders. Whether you're trading in a calm market or are willing to be risky enough to trade when the market fluctuates significantly, you should place stop-loss orders correctly. The ATR indicator signals whether the order should be broad or narrow.
The ATR indicator is used to define entry and exit points. Nevertheless, it's crucial to combine it with other tools to filter the signals.
You should remember that if you trade when the market is calm, the stop-loss can be close to the entry point. However, if the market is volatile, you should increase the size of the order. Otherwise, you risk exiting the trade early.
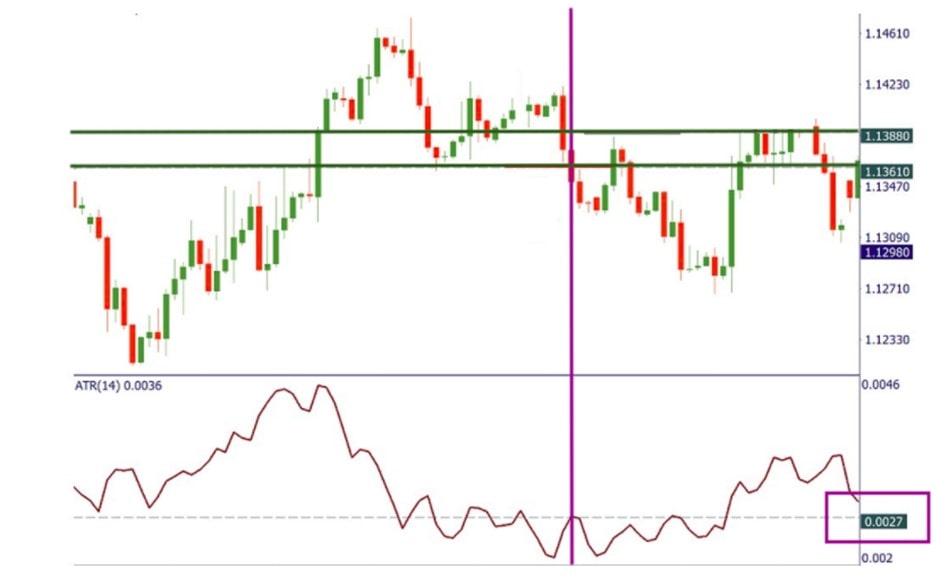
To place a stop-loss order, you need to calculate the value of the indicator when you enter the position. The Average True Range is shown with four decimal points after the zero. For example, if it shows 0.0027, it means 27 pips. So, the stop-loss order should equal 27 pips. It's also possible to place a stop-loss that is 1 to 4 times bigger than the ATR value. If you use a trailing stop, you can set it at double the ATR value.
ATR: Benefits and Limitations
By knowing the ATR indicator's advantages and disadvantages, you'll learn how to implement it most effectively.
|
Advantages |
Disadvantages |
|
A small number of settings. It's a big advantage for beginner traders because they don't have to remember all of the specific settings. |
Few timeframes. The ATR is effective only on timeframes bigger than H1. |
|
Exclusive functions. There are a few indicators that can reflect market volatility. |
No prediction. The Average True Range tool doesn't predict the market direction. The indicator reflects the strength of the volatility. |
|
Multitask. Although the Average True Range indicator is used to define the power of fluctuations, it can be applied for other aims, such as predicting stop-loss orders and the trend direction. |
Hardly read. It's not easy to read the signs the Average True Range provides. There is no average line that delineates the two zones: low volatility and high volatility. |
|
Easy to use. Although the indicator may provide unclear signals, it's widely used among traders due to its simplicity. |
Forex Trading Examples with ATR
To make our explanation clearer, we'll show an example of ATR trading.
We place the ATR with the standard setting of 14. To define the middle line, we place the Moving Average on the ATR window. As soon as the Average True Range tool breaks above the line, it means the volatility has risen. We see the confirmation because the candlesticks rose, as well.
You may wonder why the indicator should be used if the candlesticks' rise is visible. The answer to that is that the indicator can be used to avoid trading and let you increase your stop-loss order because you know that volatility is increasing.
The Most Effective ATR Strategies
As the ATR indicator is quite a complicated instrument, it's tricky to include it in a trading strategy. That's why we've selected two effective strategies that will help you learn this tool better.
Strategy 1
This strategy is based on increased volatility.
- Step 1. Choose an asset and a timeframe you want to trade. Remember: the indicator works better in high timeframes.
- Step 2. Place an indicator with a 20-day Exponential Moving Average.
- Step 3. We'll trade on increased volatility, which is why we should wait until the ATR line breaks above the moving average.
- Step 4. To get confirmation of increased volatility, you should check whether the price chart signals increased fluctuations. When the indicator breaks the EMA from the bottom up, the current candlestick should surpass the previous one.
- Step 5. As soon as there's a candlestick confirmation of increased volatility, it's time to open a trade. It would be best if you opened a position at the opening price of the next candlestick that forms after the one that confirmed increased volatility.
- Step 6. When trading on increased volatility, you should place a take-profit order ahead of it. Previously, we stated that the Average True Range indicator can predict the size of the stop-loss. Check the value of the ATR at the time when you open a trade. This figure will equal the number of pips you will probably earn. For instance, if the ATR is 0.0018, the take-profit should be placed 18 pips from the entry point following the market direction.
- Step 7. Placing a stop-loss order is key to successful trading. The stop-loss level should be located below the breakout candlestick, i.e., the one that confirmed increased volatility.
This strategy works both for buy and sell trades. However, it's important to remember that the indicator doesn't predict the market direction; it only shows the strength of volatility.
Strategy 2
The second strategy resembles the first one but includes some points that may be useful if the market conditions don't fit those from the first strategy.
- Step 1. Choose the pair and timeframe that suit your aims.
- Step 2. Set an ATR indicator. You can draw the middle line by eye.
- Step 3. Wait until the indicator breaks above the middle line.
- Step 4. The price chart must confirm the continuation of the trend. Draw a resistance/support line regarding the trade you enter. If the candlestick breaks the line, you can enter the trade.
- Step 5. To define the take-profit order, you should check the ATR value when you open a trade. It will be your first take-profit level. It's also possible to place a second take-profit. To do so, double the ATR value. We mentioned that the stop-loss order could equal 1-4 times the ATR value; the same rule applies to a take-profit order.
- Step 6. To define a stop-loss level, you should draw a support/resistance line regarding the trade direction before the breakout candlestick.
Just like the previous strategy, this one works both for buy and sell trades.
Tips for Traders
The ATR indicator is a unique technical tool. That's why investors make a lot of mistakes when using it:
- Wrong functions. Many traders forget that the indicator doesn't define the market's direction but instead determines the strength of volatility. So, if the indicator's line rises, it doesn't mean that the market is bullish. It just means that volatility is high. If the indicator falls, it's a sign of market consolidation.
- Wrong timeframes. The indicator won't work effectively on small timeframes. It's recommended to use hourly periods.
- Wrong settings. Although the indicator has only one setting, the period, the odds are there will be wrong numbers. If you set a small period, the number of false signals will increase. If the period is too big, you're likely to miss a good point.
Conclusion
To conclude, the ATR indicator is among the few technical tools that measure market volatility. It's well-known among investors because of its simplicity. Moreover, there aren't many tools that can be easily set on any trading platform.
However, it's not always clear what the indicator alerts are about. That's why it's crucial to test its signals before entering the real market. To do this, you can use a Libertex demo account. It includes standard currency pairs and CFD assets, making it a great option to practice the indicator and learn how to trade different assets.
Let's sum up and answer essential questions about the Average True Range indicator.
FAQ
How Do You Use the ATR Indicator?
The Average True Range indicator is used to determine the strength of market volatility.
How Do You Read an ATR Indicator?
If the indicator breaks above the average line, market volatility is high. When the index falls, it means the market is consolidating.
What Is the ATR Indicator?
The ATR indicator is an oscillator used to identify the strength of the market's fluctuations, not its direction.
How Do You Calculate ATR?
To calculate this indicator, you need to measure three figures. The largest one will be the ATR.
Disclaimer: The information in this article is not intended to be and does not constitute investment advice or any other form of advice or recommendation of any sort offered or endorsed by Libertex. Past performance does not guarantee future results.
Why trade with Libertex?
- Get access to a free demo account free of charge.
- Enjoy technical support from an operator 5 days a week, from 9 a.m. to 9 p.m. (Central European Standard Time).
- Use a multiplier of up to 1:30 (for retail clients).
- Operate on a platform for any device: Libertex and MetaTrader.