
Gold Price Forecast 2026-2030: Expert Predictions and Market Analysis
Prepared by the Libertex team
Content reviewed internally in accordance with regulatory standards.
Gold prices are projected to close 2026 at around $3,942, with long-term price targets placing them much higher: between $9,166 and $14,638 by 2030–2035.
However, these numbers are only part of a much broader story. Behind them lie the forces that shape gold's long-term behaviour: anticipated shifts in Federal Reserve policy, ongoing central bank accumulation and structural supply constraints that continue to tighten the market. Rather than treating these projections as certainties, this guide approaches them as scenarios, frameworks for understanding where gold may head as macroeconomic, geopolitical conditions and market volatilitу evolve.
In 2025, renewed focus on gold is coming primarily from portfolio building. Many institutional investors now treat gold as a strategic holding, typically allocating about 5–10% of diversified portfolios to hedge equity volatility, inflation shocks and currency risk. At the same time, central banks have been net buyers for over a decade, with emerging-market authorities steadily increasing gold reserves as part of de-dollarisation and reserve diversification, providing structural support for prices. Against a backdrop of elevated public and private debt, persistent inflation and uncertain monetary policy, liquid gold ETFs, digital gold products and CFD platforms make it easier to implement both long-term allocations and short-term gold trades. This context underpins the forecasts, fundamental supply-and-demand analysis and technical signals explored in this guide.
Gold price chart
Short-term gold price predictions for 2026 by WalletInvestor
Want to know how gold is expected to perform over the coming week? This 2026 gold price prediction, based on the forecast from WalletInvestor, covers the period from October 28 to November 3, 2026 and shows the projected price, as well as the expected daily low and high.
| Date | Price | Low | High |
| 28.10.2026 | 4,095.69 | 3,890.91 | 4,300.48 |
| 29.10.2026 | 4,083.33 | 3,879.16 | 4,287.49 |
| 30.10.2026 | 4,126.94 | 3,920.59 | 4,333.29 |
| 31.10.2026 | 4,137.83 | 3,930.94 | 4,344.72 |
| 01.11.2026 | 4,172.15 | 3,963.54 | 4,380.76 |
| 02.11.2026 | 4,188.00 | 3,978.60 | 4,397.40 |
| 03.11.2026 | 4,178.73 | 3,969.79 | 4,387.67 |
Source: Wallet Investor (20.10.2026)
2026 gold price forecast by LongForecast
Gold prices in 2026 are expected to remain underpinned by a likely easing cycle from the Federal Reserve: anticipated another rate cuts or at least a pause in further tightening should reduce real interest rates, a key boost for bullion. In addition, continued accumulation by central banks driven by reserve diversification and de-dollarisation trends provides structural demand support. According to Longforecast, gold prices are expected to show significant movement throughout the year.
Data for 2026 begins in October, when gold closes near $4,180 after trading between $3,891 and $4,404. November brings a modest gain to $4,203 (+0.9%), with the low of $3,717 recorded during the month. December then sees a decline to a year-end close of $3,942 — reflecting a drop of approximately 5.3% from the current price. The pattern shows a stable autumn followed by a pullback at year-end.
| Month | Low-High | Close | Total,% |
| October 2026 | 3,891-4,404 | 4,180 | 0.4% |
| November 2026 | 3,717-4,413 | 4,203 | 0.9% |
| December 2026 | 3,745-4,203 | 3,942 | -5.3% |
Source: Longforecast.com (20.10.2026)
2027 gold price forecast by LongForecast
The 2027 outlook for gold reflects mounting medium-term supply-side pressures. Gold mining production continues to face limitations from declining ore grades, while rising production costs - which, for many operations, average around $1,200-$1,400 per ounce - reinforce higher long-term price floors. According to Longforecast, these structural supply constraints help support the year's projected range.
In addition, shifting dynamics within the global macroeconomic cycle and an increasingly complex geopolitical landscape contribute to wider forecast variance for the year. Investment flows, including ETF positioning and broader institutional allocation shifts, are likely to fluctuate with equity-market performance and risk sentiment, driving periods of stronger safe-haven demand.
Early 2027 opens at $4,186 with modest moves in January and February, but the first half turns increasingly difficult — prices slide through spring and reach a trough near $3,513 in June. The second half stages a sustained recovery: July and August begin to stabilise, September and October push higher, and the strongest momentum arrives in November and December, with the year closing at $4,933 — its highest monthly close of the year and a gain of approximately 17.8% for 2027.
| Month | Low-High | Close | Total,% |
| January 2027 | 3,942-4,395 | 4,186 | 0.5% |
| February 2027 | 4,058-4,486 | 4,272 | 2.6% |
| March 2027 | 3,807-4,272 | 4,007 | -3.8% |
| April 2027 | 3,775-4,173 | 3,974 | -4.6% |
| May 2027 | 3,745-4,139 | 3,942 | -5.3% |
| June 2027 | 3,513-3,942 | 3,698 | -11.2% |
| July 2027 | 3,698-4,123 | 3,927 | -5.7% |
| August 2027 | 3,927-4,379 | 4,170 | 0.1% |
| September 2027 | 4,031-4,455 | 4,243 | 1.9% |
| October 2027 | 4,243-4,721 | 4,496 | 8% |
| November 2027 | 4,413-4,877 | 4,645 | 11.6% |
| December 2027 | 4,645-5,180 | 4,933 | 18.5% |
Source: Longforecast (20.10.2026)
2028 gold price forecast by WalletInvestor
Forecasting gold for 2028 carries heightened uncertainty, and the economic outlook is bifurcated between potential soft-landing and deeper recession scenarios. If a recession materialises, higher recession risk increases safe-haven demand for gold, and historically, such economic downturns benefit gold prices, creating wider forecast ranges.
Conversely, if inflation persists, gold's role as an inflation hedge remains strong. Persistent inflation supports gold demand via its influence on real interest rates and inflation expectations. According to WalletInvestor, the 2028 projections reflect these uncertainties.
The table suggests a modest but steady uptrend through most of 2028, with prices rising from around $4,642 at the start of the year to a peak average of $5,124 in September. There are no abrupt spikes. Growth appears relatively smooth, with a slight softening in late autumn — November averages around $4,998, a touch below the September high — before easing slightly to $4,945 in December, closing the year up roughly 6.5% overall.
| Date | Min. price | Avg. price | Max. price | Change % |
| January 2028 | 4,486.44 | 4,642.16 | 4,743.84 | 14.61 % |
| February 2028 | 4,701.91 | 4,813.29 | 4,900.29 | 18.39 % |
| March 2028 | 4,665.13 | 4,795.61 | 4,900.32 | 18.39 % |
| April 2028 | 4,859.43 | 4,949.42 | 5,038.35 | 21.72 % |
| May 2028 | 4,747.37 | 4,856.39 | 4,948.21 | 19.55 % |
| June 2028 | 4,837.88 | 4,913.95 | 5,040.6 | 21.78 % |
| July 2028 | 4,710.29 | 4,828.7 | 4,954.07 | 19.69 % |
| August 2028 | 4,900.51 | 5,005.69 | 5,163.22 | 24.74 % |
| September 2028 | 4,974.25 | 5,124.28 | 5,274.84 | 27.44 % |
| October 2028 | 4,938.09 | 4,993.47 | 5,084.65 | 22.84 % |
| November 2028 | 4,945.78 | 4,997.98 | 5,048.59 | 21.97 % |
| December 2028 | 4,836.58 | 4,945.09 | 5,081.17 | 22.76 % |
Source: WalletInvestor (20.10.2026)
2029 gold price forecast by LongForecast
Forecasts for 2029 are highly speculative and should be treated as directional rather than precise targets. According to Longforecast, Asian markets, which account for the majority of global physical gold demand, remain the key structural pillar. Growing wealth and demographic trends in China and India continue to drive jewellery and investment purchases, supporting long-term gold consumption.
At the same time, an evolving multipolar world order and persistent uncertainty and geopolitical issues maintain a premium on gold as a neutral asset, encouraging strategic accumulation by investors and sovereigns.
The forecast points to a broadly rising year in 2029, opening at $6,702 in January and climbing steadily through the first half to reach $7,834 by June. A brief consolidation follows in July and August before prices rebound strongly into Q4, with the peak of $8,570 recorded in November. December then sees a modest pullback to $8,126, leaving the year with an overall gain of approximately 21.2%. The pattern combines steady appreciation in H1, a mid-summer pause, a sharp late-year surge, and a mild year-end retreat.
| Month | Low-High | Close | Total,% |
| January 2029 | 6,367-7,037 | 6,702 | 61% |
| February 2029 | 6,702-7,474 | 7,118 | 70.9% |
| March 2029 | 6,723-7,431 | 7,077 | 70% |
| April 2029 | 6,879-7,603 | 7,241 | 73.9% |
| May 2029 | 7,008-7,746 | 7,377 | 77.2% |
| June 2029 | 7,377-8,226 | 7,834 | 88.1% |
| July 2029 | 7,424-8,206 | 7,815 | 87.7% |
| August 2029 | 7,374-8,150 | 7,762 | 86.4% |
| September 2029 | 7,498-8,288 | 7,893 | 89.6% |
| October 2029 | 7,667-8,474 | 8,070 | 93.8% |
| November 2029 | 8,070-8,999 | 8,570 | 106% |
| December 2029 | 7,720-8,570 | 8,126 | 95.1% |
Source: Longforecast (20.10.2026)
Long-term gold price prediction for 2030-2035 by CoinPriceForecast
Ultra-long-term forecasts involve very high uncertainty, and the 2030–2035 outlook should be viewed as scenario-based rather than precise. According to long-range projections from CoinPriceForecast, potential reforms in the global monetary system may reshape reserve policies. The role of gold prices could increase due to currency diversification, while debt-sustainability concerns may drive interest in gold-backed alternatives.
A parallel "peak gold" thesis suggests that global production may peak in the 2030s as declining ore grades raise extraction costs and structural supply limitations provide long-term price support. Climate constraints and emerging green technologies may further influence both mining operations and industrial applications. Together, these megatrends play a key role and justify wide forecast ranges and should be treated as strategic indicators rather than trading targets.
The table shows a steady upward trajectory from 2030 to 2035, with CoinPriceForecast projecting gold at $9,125 mid-2030 and $9,166 by year-end 2030, rising to $9,991 mid-2031 and $10,808 at end-2031, then continuing to $11,260/$12,040 in 2032, $12,814/$13,035 in 2033, $13,768/$13,894 in 2034, and $14,446/$14,638 by 2035. Forecast ranges widen as long-term uncertainties accumulate, though the baseline scenario implies gradual appreciation supported by supply constraints and monetary-system risks, with outcomes potentially diverging significantly under alternative policy or technological shifts.
| Year | Mid-Year | Year-End | Tod/End,% |
| 2030 | 9,125 | 9,166 | 120 % |
| 2031 | 9,991 | 10,808 | 159 % |
| 2032 | 11,260 | 12,040 | 189 % |
| 2033 | 12,814 | 13,035 | 213 % |
| 2034 | 13,768 | 13,894 | 234 % |
| 2035 | 14,446 | 14,638 | 251 % |
Source: CoinPriceForecast (20.10.2026)
Factors influencing gold's price
There are several practical reasons that many investors choose gold as their commodity of choice. This will be useful for upcoming gold forecasts.
1. Value over time
For centuries, families have used gold as a way to preserve their wealth and pass it on to future generations. They understood that gold's value would not dwindle away to nothing.
2. The US dollar
Even though the US dollar is one of the world's most important reserve currencies, it can fall in value against other currencies (such as the period between 1998 and 2008). When this happens, the price of gold soars. For instance, during that same period, gold's price nearly tripled before going on to double again from 2008 to 2012. It ended up approaching $1,900 per ounce!
3. Inflation
As the cost of living increases, gold's price tends to rise, as well. During high-inflation years, investors have seen gold prices increase while the stock market plunges. Why? While fiat money loses its purchasing power in high-inflation years, gold is priced in those currency units and rises in value right next to cost-of-living increases.
4. Deflation
This is a time in which business activity is sluggish, prices are dropping and the economy has excessive debt (think the Great Depression and, to a lesser extent, the 2008 financial crisis). During such times, gold's purchasing power skyrockets because, during deflation, people hoard cash in the form of gold.
5. Geopolitically uncertain times
Did you know that gold is often referred to as the 'crisis commodity'? Not only do people hoard gold during times of economic insecurity, but they also buy up gold when world tensions are heightened, due to its safe-haven status. Gold's price tends to rise the most when people have little faith in their respective governments.
6. Supply constraints
While, as we mentioned before, gold's supply won't dry up, there are still constraining factors on its production. The mining of new gold from mines has been dropping since 2000. It can take 5-10 years to open up a new gold mine, so when mines close, this can increase gold prices.
Gold supply and demand dynamics: A fundamental analysis
In 2025, gold's fundamental price equilibrium is shaped by the interaction of supply and demand, rather than short-term speculation alone. On the supply side, total availability consists of mine production, recycled metal and limited official-sector (central bank) flows. In Q3 2025, total gold supply reached about 1,313 tonnes, according to the World Gold Council, with mine output around 977 tonnes (roughly three-quarters of supply) and recycled gold about 344 tonnes, just over one quarter.
Gold mining remains the dominant source of new supply and a key driver of production costs, but producers are increasingly pushed into deeper, lower-grade and more complex deposits as easily accessible ore bodies are depleted, raising extraction costs and reinforcing natural price floors.
On the demand side in 2025, gold demand comes from four main segments: jewellery, investment, technology and central banks, where central bank demand has remained particularly important. Q3 2025 data show total demand of about 1,313 tonnes, with jewelleryconsumption near 371 tonnes, technology around 82 tonnes, and central banks purchasing roughly 220 tonnes, while bar-and-coin buying plus ETF inflows account for more than half of year-to-date demand.
Unlike consumable commodities such as oil, almost all gold ever mined is set to remain in large above-ground stocks, which can re-enter the market via recycling and official-sector transactions. This makes shifts in portfolio demand and reserve management crucial for price formation.
Taken together, constrained mining supply, rising production costs and strong 2025 investment and central-bank demand create a tight supply-demand balance that supports structurally higher gold price ranges in medium- and long-term forecasts, even if short-term prices remain volatile.
The World Gold Council: Market authority and investment resources
The World Gold Council (WGC) is the leading global industry body for the gold market, representing about 30 of the world's major gold mining companies and coordinating their interests across more than 45 producing countries. In 2025, it remains the primary source of gold market intelligence, publishing its flagship Gold Demand Trends series, including the Q1–Q3 2025 reports that track supply, jewellery, technology, investment and central-bank demand in the current record-price environment. Alongside these data-heavy publications, the WGC issues strategic research, such as Gold as a Strategic Asset: 2025 edition, which analyses gold's long-term returns, diversification benefits and liquidity for institutional and retail portfolios.
The Council also promotes gold as an investment through market-development and education initiatives, including country-level studies like Why Gold in 2025? Building Indian portfolio resilience and thematic work on pension funds and digitalised gold. For investors and traders following the fundamental drivers for gold discussed in this guide — central-bank buying, ETF flows, jewellery demand and macro risk — WGC datasets and reports provide the benchmark evidence used to interpret price behaviour and to build robust, long-term allocation strategies.
Technical analysis of gold's price
In order to keep track of gold price movements and decide advantageous times to enter/exit the market, it's crucial to learn to create and read technical analysis. We'll show you how to create one and provide an example.
To a beginner, a technical analysis chart might seem intimidating. However, it's there to help you, not hurt you! It's a tool used by traders to predict market movements and turn a profit. While tech analysis is not foolproof, it can help you make educated guesses rather than risky gambles.
You simply can't be a successful short-term trader without using technical analysis tools. Either that or you need incredible, unending luck.
To create technical analysis charts, you'll first need to choose a platform. Libertex is a great place to do this. We offer all known indicators, and you can even create a free demo account to practice your trading skills.
Technical analysis indicators offered by Libertex can be broken into 3 categories:
- Trend: These tell you which direction the market is moving in. Types include MACD, Moving Average, Ichimoku Cloud, Directional Movement Index and many more.
- Oscillators: These are momentum indicators that show fluctuations bound by an upper and lower band. Some options include the Relative Strength Index, Stochastic Oscillator, True Strength Indicator and TRIX.
- Volatility: These show you how much a price is changing during a specific period of time. Libertex offers Donchian Channels, Bollinger Bands, the Relative Volatility Index and other volatility indicators.
Now, all you need to do is open a chart on your platform of choice, select the tradeable asset (in our case, gold), and select the trading indicators. For an explanation of what common indicators actually mean, check out this newbie-friendly guide from Investopedia.
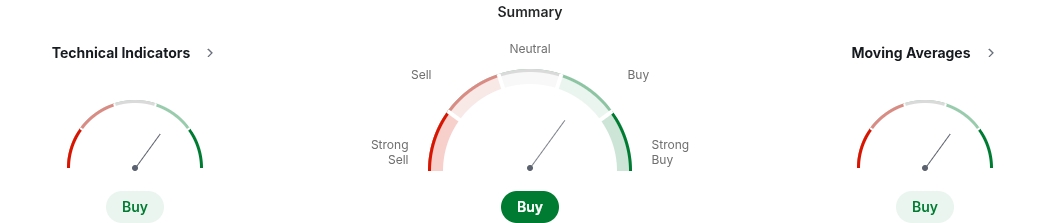
Now, this is where your timeline comes into play. If you're an intraday trader (meaning you make several trades throughout the day), this specific moment in time would be ideal for buying. For daily and monthly traders, the summary, technical indicators and moving averages also show a Buy signal.
Technical Indicators
| Name | Value | Aktion | ||
| RSI(14) | 57.52 | Buy | ||
| STOCH(9,6) | 19.76 | Oversold | ||
| STOCHRSI(14) | 5.842 | Oversold | ||
| MACD(12,26) | 457.6 | Buy | ||
| ADX(14) | 63.66 | Buy | ||
| Williams %R | -69.08 | Sell | ||
| CCI(14) | -8.91 | Neutral | ||
| ATR(14) | 427.36 | High Volatility | ||
| Highs/Lows(14) | -303.64 | Sell | ||
| Ultimate Oscillator | 43.34 | Sell | ||
| ROC | 25.02 | Buy | ||
| Bull/Bear Power(13) | 290.72 | Buy | ||
Source: Investing (20.10.2026)
Moving Averages
| Name | Simple | Exponential | |||
| MA5 | 4,195.09 | Sell | 4,260.81 | Sell | |
| MA10 | 4,486.97 | Sell | 4,261.95 | Sell | |
| MA20 | 4,067.49 | Buy | 3,991.04 | Buy | |
| MA50 | 2,929.96 | Buy | 3,230.33 | Buy | |
| MA100 | 2,283.63 | Buy | 2,588.57 | Buy | |
| MA200 | 1,818.83 | Buy | 1,977.68 | Buy | |
Source: Investing (20.10.2026)
Pivot Points
| Name | S3 | S2 | S1 | Pivot Points | R1 | R2 | R3 |
| Classic | 3,437.67 | 3,755.83 | 4,118.67 | 4,436.83 | 4,799.67 | 5,117.83 | 5,480.67 |
| Fibonacci | 3,755.83 | 4,015.98 | 4,176.69 | 4,436.83 | 4,696.98 | 4,857.69 | 5,117.83 |
| Camarilla | 4,294.23 | 4,356.65 | 4,419.08 | 4,436.83 | 4,543.93 | 4,606.35 | 4,668.78 |
| Woodie’s | 3,460.00 | 3,767.00 | 4,141.00 | 4,448.00 | 4,822.00 | 5,129.00 | 5,503.00 |
| DeMark’s | - | - | 4,277.75 | 4,516.38 | 4,958.75 | - | - |
Source: Investing( 20.10.2026)
Gold Price History for the Last 10 Years
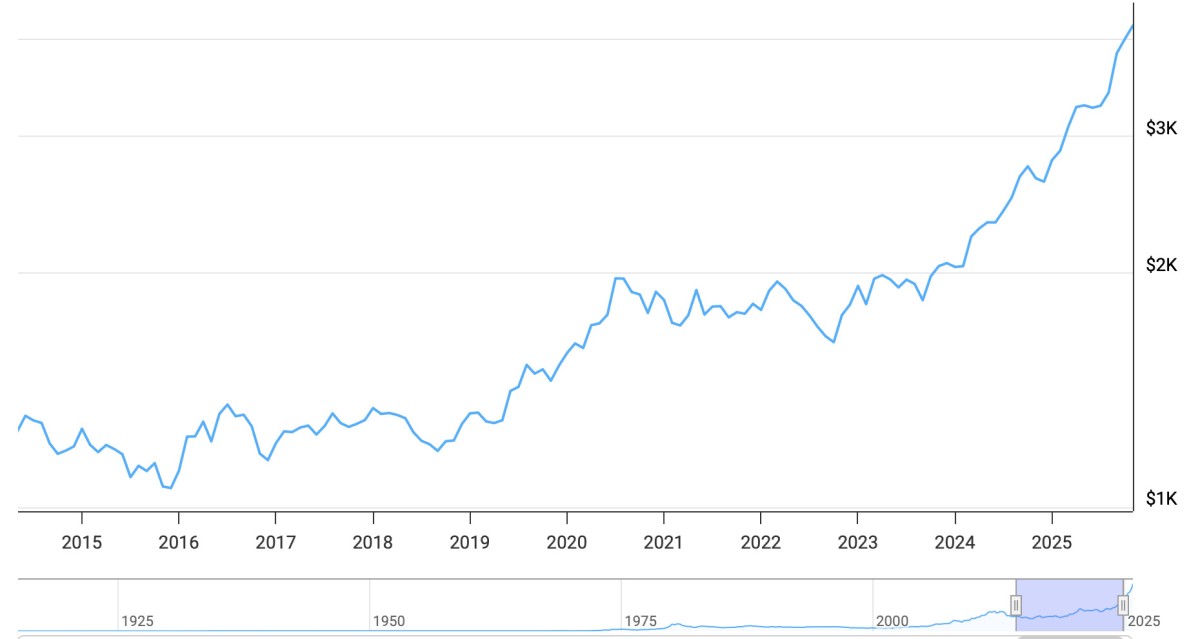
It started out the period with a dip to around $1,050–1,100 per oz in late 2015; after several years of modest growth and relative stability from 2016 to 2019, gold began rising more sharply from 2020 as global uncertainty increased. By 2025, it had surged past $4,155 per oz, reaching new record highs.
Source: Macrotrends.net (28.11.2025)
Of course, gold's price over 10 years is simply numbers. What's more important is to understand the factors behind those numbers. We've compiled a timeline of events that have contributed to the ups and downs of gold price history for 2015–2025:
- 2015: A strong US dollar and weak global growth pushed gold toward $1,050 per oz.
- 2016–2017: Mild dollar weakening supported a gradual price recovery.
- 2018–2019: Relative stabilisation with modest fluctuations.
- 2020: The COVID-19 outbreak caused severe uncertainty and drove strong safe-haven demand.
- 2021–2022: Inflation pressure and shifting central-bank expectations kept gold supported.
- 2023–2024: Heightened geopolitical tensions and solid central-bank purchases fueled further strength.
- 2025: Gold moved above $4,100 per oz for the first time, lifted by safe-haven inflows during economic and geopolitical stress, a weakening dollar, expectations of Federal Reserve rate cuts, and strong buying from central banks and institutional investors.
As you can see, the chart is a visualisation of gold's direct tie to the USD price and times of crisis, and by 2025, it reflects broader structural shifts shaping global markets. Gold now stands as a key safe-haven asset amid ongoing geopolitical uncertainty, monetary-policy changes, and elevated macroeconomic risks.

Source: Macrotrends.net (28.11.2025)
How Is Gold Doing Now?
Did you notice in the charts above how gold's rally didn't stop in 2025? After breaking above $4,300 per oz for the first time in late 2025, the metal kept climbing into early 2026, hitting a new all-time high of $5,597 per oz on 29 January 2026. Since then, the market has pulled back sharply and is now consolidating in the $4,150–4,280 range as of early August 2026, as the chart shows. This pattern reflects a cooling-off after an overbought rally, combined with shifting expectations around US Federal Reserve rate policy and ongoing political and economic uncertainty

Source: TradingView (28.11.2025)
Does this mean you should rush into gold now? Not necessarily. While forecasts for 2026–2027 point to a range of $3,513–$5,180 per oz, analysts also warn that the recent surge makes the market more vulnerable to sharp swings.
There are 3 key reasons for caution here:
- Stretched prices after a major year-to-date rally in gold could trigger pullbacks if investor sentiment improves.
- Uncertain Federal Reserve policy means that any delay in rate cuts may pressure gold by pushing real yields higher.
- Crowded positioning among long-term buyers raises the risk of profit-taking if expectations shift.
So while gold remains historically strong, today's volatile environment calls for thoughtful timing rather than automatic buying.
What to do with gold: Trade or invest?
There is no guarantee of profit with gold investments. While this metal remains a safe investment, its performance has a converse relationship with economic prosperity. This precious metal has its ups and downs, and there's no guarantee that it will always increase in price. Therefore, before investing in gold, it's crucial to read opinions from experts, examine market trends and create technical analysis charts.
If you want to get in on gold but aren't ready to make a long-term investment, perhaps trading CFDs would be a better choice. When you trade CFDs, you can make a profit from the volatility of gold by speculating on its future price. The Libertex trading platform enables savvy traders to trade CFDs for gold and more.
FAQ
Is gold a good investment in 2026?
Gold in 2026 is navigating a corrective phase after hitting new all-time highs, with forecasts pointing to a trading range of roughly $3,717 to $4,413 for the year. Central-bank buying and institutional demand provide structural support, but near-term volatility is elevated. It can be a strategic long-term holding, though short-term pullbacks remain likely.
Is gold worth buying?
Gold still holds its reputation as a safe-haven asset, supported by structural demand and limited supply, but its sharp rally in recent years means investors should be cautious with timing. With 2026 forecasts spanning a wide range - from around $3,717 on the low side to $4,413 at the high - entry points matter. It remains valuable for diversification, though not a guaranteed profit.
What will gold be worth in 2026?
According to Longforecast, projections for the rest of 2026 place gold in a range of $3,717 to $4,413, with data starting near $4,180 in October before easing to close around $3,942 by December - a decline of approximately 5.3% from the current price, driven by shifting Fed policy expectations and broader market conditions.
Is gold expected to drop in price?
Short-term declines are possible due to uncertainty around Federal Reserve rate cuts and crowded long positions. However, long-term structural support remains strong.
What will gold be worth in 2030?
CoinPriceForecast's estimates predict that gold could reach $9,125 mid-2030 and $9,166 by year-end 2030.
Is it wise to invest in gold now?
Gold remains fundamentally supported by central-bank demand, tight supply and elevated macro risks, but the recent surge makes short-term volatility high. Studying the market before entering is advisable; CFDs remain an option for those avoiding long-term commitments.
Will gold's price rise in the future?
Most analysts expect the price of gold to rise in the future.
Will gold go to $5000 an ounce?
Based on 2026-2027 forecasts, gold is expected to trade between $3,513 and $5,180, with $5,000 reached only by December 2027 (high of $5,180, close to $4,933).
What will gold be worth in 5 years from now?
Five years out, in 2031, CoinPriceForecast projects gold between $9,991 (mid-year) and $10,808 (year-end).
Will gold go to $10,000 an ounce?
Long-term forecasts suggest prices may exceed $10,000 by the end of 2031, with CoinPriceForecast estimates reaching $13,894 in 2034 and $14,638 in 2035.
Disclaimer: The information in this article is not intended to be and does not constitute investment advice or any other form of advice or recommendation of any sort offered or endorsed by Libertex. Past performance does not guarantee future results.
Why trade with Libertex?
- Get access to a free demo account free of charge.
- Enjoy technical support from an operator 5 days a week, from 9 a.m. to 9 p.m. (Central European Standard Time).
- Use a multiplier of up to 1:30 (for retail clients).
- Operate on a platform for any device: Libertex and MetaTrader.