
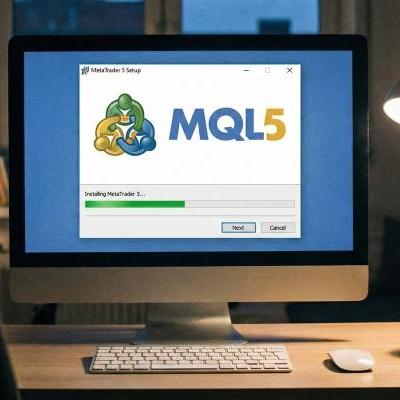
A MetaTrader 5 demo account allows traders to get to know the platform's features without any financial risk. These virtual trading accounts provide access to real-time market data and all MT5 platform features, while trading with virtual capital. Risk-free trading on a MetaTrader 5 account enables traders to develop and test trading strategies before using real capital.
Educational articles
Trading
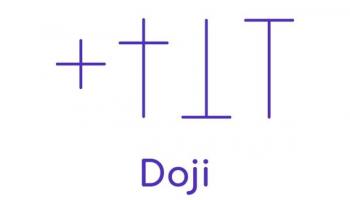
Every trader should be equipped with a wide range of technical tools to define the market direction. These also include candlestick patterns, though not all of them can show the exact market movement. A Doji pattern shows market uncertainties, not price direction. Some may ask, "Why identify a candlestick that doesn't predict price movement?" This article will reveal the purpose of the Doji candlestick, its types and how to use it in trading.

If you're looking for an investment strategy that will suit you, you first need to take note of your objectives and why you want to trade in the first place. As you go through your investing journey, you'll gain valuable experience and knowledge that you can use to increase your profit.
Over-The-Counter markets are popular among investors and traders. This term is mostly associated with trading companies' stocks, but the OTC market also features a wide range of other financial instruments, including currencies, commodities and bonds. OTC markets differ from standard exchanges, so read our guide to find out which market suits you best.
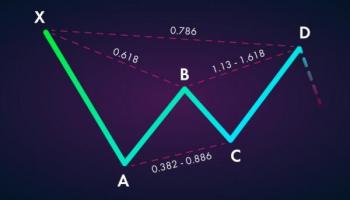
Harmonic patterns are one of the most complicated trading instruments. To draw them on the chart, you need to combine lots of knowledge. But we wanted to make your life easier, so we gathered the most relevant information about harmonic patterns in forex in one guide. Keep reading to find the most reliable signals.

We hear a lot about the New York Stock Exchange and Nasdaq in the news because financial markets rely on their movements to evaluate the world's economic sentiment. Yet, the Tokyo Stock Exchange, the Shanghai Stock Exchange and the Hong Kong Stock Exchange are among the world's largest markets.
When reading analytical outlooks on price movements, you might run across the word "pullback". Many trading strategies are based on pullback action, and pullbacks allow you to trade against the trend.

Whether you want to trade in the forex, stock, bond or options markets, you should know how the financial world works in general. One of the key terms you should be aware of is the stock exchange. In our guide, we'll explain the basic principles of any stock exchange, talk about the history of exchanges and teach you how to enter the exciting world of stocks.

The moving average is one of the most effective and frequently used indicators. We can say it's a basic element of technical analysis because it serves both as a unique indicator and as a part of other technical tools. Every trader should know how to apply moving averages to the chart, which is why we'll tell you all the secrets of this mathematical instrument.
Liquidity is a common term in the financial world. Market liquidity determines the speed of market operations and an investor's ability to earn money on a specific asset. Financial liquidity allows investors to define securities that can be easily converted to cash. If you've just started your trading path, please slow down for a while and read this tutorial.

If you participate in the financial markets, you'll be trading various types of financial instruments. This page covers everything you need to know about them and how to choose the ones best suited to your objectives.